Mateusz BOGDAN
My personal site, with a short presentation of who I am, my academic and professional activities and research interests !
| Home |
|---|
| About Me |
| Research |
| Publications |
| Teachings |
| Datavisualisation |
| Code |
| Inspirations - Links |
Inspirations
A curated collection of tools, datasets, libraries and resources I regularly use or find useful for scientific computing, visualization and environmental analysis.
I try to keep this section up to date whenever I come across something interesting.
Last updated: June 2026
Science & mathematical intuition 🔬
Resources that help build intuition about mathematics, physics and scientific concepts through visualization, interactive simulations and educational material.
- Euclid’s Elements [geometry][history]: The Elements of Euclid, in which coloured diagrams and symbols are used instead of letters for the greater ease of learners. Based on a book by Byrne, published in 1847, the “web version” has been made by Nicholas Rougeux, a data artist and designer.
- 3Blue1Brown [math][visualization]: Mathematics visualizations famous for their clarity and aesthetic animations.
- Distill [interactive][ML][visualization]: Beautiful interactive scientific articles explaining complex topics (machine learning, mathematics, optimization, etc.) through visualization.
- Seeing Theory [statistics][interactive]: An interactive visual introduction to probability and statistics.
- Falstad Physics Simulations [physics][simulations]: A collection of interactive simulations for physics, electronics, waves, optics, and mathematics.
- The NIST Digital Library of Mathematical Functions [reference][mathematics]: Authoritative reference for special functions used in mathematics and physics.
- Scale of the Universe [interactive][science]: Interactive zoom showing the size of objects from subatomic particles to the observable universe.
- The Feynman Lectures on Physics [physics][intuition]: Probably the most famous collection of physics lectures ever written. Particularly valuable for developing physical intuition.
Data visualization 📊
Tools, references and inspiration related to scientific visualization, interface design and generative graphics.
Inspiration & storytelling
- Information Is Beautiful [dataviz][storytelling]: A famous collection of highly polished infographics and visual explanations of complex topics.
- FlowingData [dataviz][blog]: A long-running blog dedicated to data visualization projects and techniques.
Colormap theory
- SciVisColor Portal [colormap][scientific-viz]: A website to explore various color schemes for scientific visualization, with the possibility to download them in
xmlformat. - Turbo Colormap [colormap][scientific-viz]: Perceptually improved alternative to the classic rainbow colormap designed by Google.
- Color Brewer [colormap][maps]: A widely used tool for selecting perceptually balanced colormaps for maps and data visualization.
- Advice on colormaps for scientific visualization can be found here.
- Paul Tol colormaps [colormap][accessibility]: Many guidelines and examples, including recommendations for colorblind-safe palettes.
- Scientific Colour Maps [colormap][scientific-viz]: Perceptually uniform colormaps designed for scientific visualization and recommended for avoiding misleading visual interpretation.
UI / UX tools
Some tools and resources useful when designing user interfaces and dashboards.
I often use them when building interactive applications with Dash.
- Iconify [icons][UI][dash]: Huge searchable catalog of open-source icon sets. Very handy for dashboards and web apps, especially when using tools such as
dash-iconify. - The Noun Project [icons][UI]: Large library of vector icons created by designers worldwide.
- Omatsuri – Color Shades Generator [UI][colors]: Generate full color palettes and shades from a base color.
- UI Gradients [UI][gradients]: Collection of ready-to-use gradient palettes often used in modern interfaces.
- Haikei [UI][SVG]: Generator for SVG backgrounds and shapes useful for dashboards and visual interfaces.
Rendering & lighting assets
- ambientCG [rendering][textures][PBR]: Large library of high-quality PBR textures, HDRIs, and 3D assets.
- Poly Haven HDRIs [rendering][HDRI][lighting]: Free high-dynamic-range environment maps used for realistic lighting and reflections.
- HDRI Skies [rendering][HDRI][lighting]: HDR sky maps designed for environment lighting in physically based rendering workflows.
Generative / creative visualization
- Processing [creative-coding][visualization]: Creative coding framework widely used for generative art and experimental visualizations.
- OpenProcessing [creative-coding][gallery]: Gallery of generative visualizations and sketches created with Processing and p5.js.
- ShaderToy [GPU][shaders][visualization]: Large collection of GPU shader experiments and procedural visualizations.
Scientific visualization software
- ParaView [scientific-viz][CFD][post-processing]: Open-source application for large-scale scientific data analysis and visualization, widely used for CFD and simulation post-processing.
- Blender [3D][rendering]: Open-source 3D creation suite often used for high-quality rendering of scientific models and simulations.
Maps & geospatial visualizations 🗺️
Interactive maps and geospatial visualizations related to climate, environmental data and global infrastructure.
Climate and environmental data
A collection of interactive maps showing various types of environmental and climate data.
- Earth Nullschool [maps][climate][winds]: Interactive visualization of global wind, weather, ocean currents, and pollution conditions, updated every three hours.
- Blitzortung [maps][lightning]: Live world lightning detection network.
- Mapbox WebGL wind demo [maps][WebGL][winds]: Global wind visualization using WebGL
- Electricity Map [maps][energy]: European electricity map with live production, consumption, and cross-border flows.
- Darksky Maps [maps][weather]: Worldwide meteorological data visualization (1-week history)
- Interactive IPCC Atlas [maps][climate]: Tool for flexible spatial and temporal analyses of observed and projected climate change information used in the IPCC Sixth Assessment Report.
- Windy [maps][weather][winds]: One of the best real-time visualizations of weather, wind, and atmospheric data.
- Where the Rain Fell [maps][weather][rain]: An original visualization of monthly rainfall across the globe, based on ERA5 data.
Geographic curiosities
- The True Size Of [maps][cartography]: Compare the real size of countries without map projection distortions.
- Metropolitan [maps][transport]: A nice map of Paris’ underground metro
- David Rumsey Map Collection [maps][history]: A beautiful collection of historical maps available for browsing and high-resolution download.
- Flight Radar 24 [maps][aviation]: Live global air traffic visualization.
- Submarine Cable Map [maps][infrastructure]: Interactive visualization of global internet infrastructure.
- ASCII OSM [maps][geek]: ASCII cartography in the browser.
Applied Physics & Engineering ⚙️
Resources about simulation, uncertainty, heat transfer, thermal comfort and the practical application of physics to engineering problems.
- Building Energy Geeks [building-science][energy][engineering]: A collection of articles by S. Rouchier on building energy modelling, uncertainty quantification, Bayesian methods and the practical application of building physics.
- Statistical Rethinking [bayesian][statistics][book]: Richard McElreath’s modern introduction to Bayesian inference. Less a statistics book than a different way of reasoning under uncertainty.
- Building Physics - Applications in Python [building-physics][python][engineering]: The parti pris in this book is to show the link between the governing equations and how to solve them, aiming at a practical use (i.e. ”how to make things work”). It can be seen as a toolbox for simulation engineering, a basis for the illustration of theory or a kick-start for the study of more complex problems. By a friend E. Walther.
- A Heat Transfer Textbook [heat-transfer][thermodynamics][book]: Open textbook by Lienhard covering conduction, convection and radiation. One of the best freely available references on heat transfer.
- CBE Thermal Comfort Tool [comfort][interactive]: Interactive implementation of ASHRAE 55 and adaptive comfort models.
Climate databases and tools ☁️
Some useful sources for scientific and environmental data.
- Copernicus Climate Data Store [climate][datasets][ERA5]: ERA5 and other climate reanalysis datasets.
- Our World in Data [datasets][climate][energy]: Clean datasets and visualizations about global development, climate, and energy.
- OpenTopography [datasets][topography][LiDAR]: Open-access platform providing high-resolution topography datasets such as LiDAR and digital elevation models, widely used in geoscience and environmental analysis.
Measurements & records
- NOAA Hourly Data: Historical and present meteorological records worldwide. Data from the ISD (_Integrated Surface Database)._
- NOAA NCEI – Large archive of environmental and meteorological observations.
- Meteostat: Free weather and climate data with a convenient Python API.
- NASA Earthdata – Access to a wide range of Earth observation datasets.
EPW files
EPW files are nowadays something of a standard format for meteorological data.
The most common use is the TMY (Typical Meteorological Year), which represents typical climate conditions based on the last 25–30 years.
- Climate.OneBuilding.Org: The main source of TMY EPW datasets.
- EPWMap: Interactive map to download EPW files, developed by the Ladybug Tools team.
Tools for visualization
- Andrew Marsh Apps: Visualization tools for EPW meteorological data, including sun paths, shading analysis, and schedule editors.
- epwvis: Online viewer and analysis tool for EnergyPlus Weather (EPW) files.
- CBE Clima Tool: Web application for climate data analysis and visualization developed by Berkeley’s CBE Lab.
- ClimaPlus: Early-design web tool developed at MIT to support the design of naturally ventilated and hybrid buildings.
Python libraries 🐍
Python libraries commonly used in my workflows for scientific computing, environmental analysis, geospatial processing and visualization.
Python libraries commonly used in my workflows for scientific computing, environmental analysis, geospatial processing and visualization.
Scientific ecosystem
Some foundational libraries used in most scientific Python workflows:
- NumPy [python][arrays][numerical]: Fundamental library for numerical computing in Python, providing efficient multidimensional arrays and mathematical operations.
- SciPy [python][scientific-computing]: Collection of algorithms for scientific computing including optimization, integration, interpolation, signal processing and linear algebra.
- Pandas [python][data-analysis]: Library for data analysis and manipulation built around powerful tabular data structures.
- Xarray [python][climate][multidimensional]: Library for working with labelled multi-dimensional arrays, widely used in climate and geoscience datasets.
Geometry, meshes and computational geometry
- The PyVista project [python][3D][VTK][meshes], with: PyVista / PyMeshFix / TetGen. 3D plotting and mesh analysis through a streamlined interface for the Visualization Toolkit (VTK). A set of wrappers designed to simplify the use of VTK — often described as “VTK for humans”.
- Vedo [python][VTK][3D]: Lightweight Python module for scientific visualization built on top of VTK, particularly convenient for quick mesh exploration, point clouds and volumetric data.
- Trimesh [python][meshes]: Pure Python library for loading and manipulating triangular meshes with an emphasis on watertight surfaces.
- meshio [python][meshes][CFD][FEM]: Python library for reading and writing many mesh formats used in CFD and FEM simulations.
- Shapely [python][geometry][GIS]: Python library for manipulation and analysis of planar geometric objects based on GEOS.
- Pygalmesh [python][meshing]: Python interface to CGAL for high-quality mesh generation.
- Triangle [python][meshing][triangulation]: Classic tool for two-dimensional quality mesh generation and Delaunay triangulation.
- Polyscope [python][meshes][viewer]: Interactive viewer for meshes and geometric data widely used in geometry processing research.
Climate and geospatial data
- UWG [python][urban-climate][EPW]: Urban Weather Generator — a Python tool for modeling the urban heat island effect by morphing rural EPW weather files into urban-canyon conditions.
- wrf-python [python][WRF][meteorology]: Collection of diagnostic and interpolation routines for output from the Weather Research and Forecasting (WRF-ARW) model, with plotting helpers.
- GeoPandas [python][GIS][geospatial]: Extends pandas to allow spatial operations on geometric types such as points, lines and polygons.
- Rasterio [python][GIS][rasters]: Library for reading and writing geospatial raster data formats (GeoTIFF, etc.) based on GDAL.
- rioxarray [python][GIS][xarray]: Extension of xarray for geospatial raster data, combining the power of xarray with rasterio.
- PyProj [python][GIS][projections]: Python interface to the PROJ library for coordinate transformations and projections.
- Cartopy [python][maps][plotting]: Library for geospatial plotting and map projections built on top of Matplotlib.
- xclim [python][climate][indices]: Climate services library built on xarray and dask, useful for computing climate indices and bias-adjusting large climate datasets.
- MetPy [python][meteorology]: Meteorological tools for atmospheric calculations, data parsing and visualization.
- salem [python][climate][geospatial]: Geospatial utilities designed for climate and meteorological datasets.
- cfgrib [python][GRIB][climate]: Python interface for reading GRIB files commonly used in atmospheric and weather model data.
- osmnx [python][OpenStreetMap][geospatial]: A Python package to easily download, model, analyze, and visualize street networks and other geospatial features from OpenStreetMap.
Environmental and building science
- pvlib [python][solar][environment]: Python library for modeling solar radiation and photovoltaic systems using meteorological data.
- Pysolar [python][solar]: Python library for simulating solar position and irradiation with precise ephemeris calculations.
- ladybug [python][building-science][climate]: Environmental analysis tools for weather data, solar geometry and climate metrics used in building performance analysis.
- honeybee [python][building-simulation]: Framework for environmental building simulations including daylight, energy and comfort analysis.
- pythermalcomfort [python][comfort][thermal]: Python package implementing many thermal comfort models such as PMV, PPD, UTCI and adaptive comfort.
- windrose [python][wind][visualization]: Library for creating wind rose diagrams from meteorological wind datasets.
- OpenAQ [python][air-quality][API]: Python client for accessing the global OpenAQ air quality dataset.
Performance and parallel computing
- Numba [python][performance][JIT]: JIT compiler translating a subset of Python and NumPy code into fast machine code.
- Multiprocessing [python][parallel]: Standard Python library enabling parallel execution through subprocesses and full CPU utilization.
- Joblib [python][parallel][caching]: Lightweight tools for function caching, pipelining and simple parallel computing.
- Dask [python][parallel][big-data]: Parallel computing library that scales NumPy, pandas and xarray workflows to larger-than-memory datasets.
Visualization and plotting
- Matplotlib [python][plotting]: The foundational Python library for scientific plotting.
- Plotly [python][interactive][dashboards]: Interactive plotting library for building web-based visualizations and dashboards.
- Bokeh [python][interactive][web]: Interactive visualization library for modern web browsers.
- Holoviews [python][high-level][visualization]: High-level library for building complex visualizations with minimal code.
- Datashader [python][big-data][visualization]: Visualization tool for rendering extremely large datasets efficiently.
- cmocean [python][colormap][climate]: Perceptually balanced colormaps designed specifically for oceanography and climate science.
Dashboards
Frameworks and libraries for building interactive data applications and scientific dashboards in Python.
Dash ecosystem
That’s the one I use the most!
- Dash [python][dash][dashboards]: Python framework for building interactive analytical web applications using Plotly, Flask and React.
- Dash Bootstrap Components [python][dash][UI]: Collection of Bootstrap-themed components that greatly simplifies building responsive layouts and polished dashboards.
- Dash Mantine Components [python][dash][UI]: Large set of modern UI components based on the Mantine React framework, useful for building sophisticated dashboard interfaces.
- Dash Iconify [python][dash][icons]: Dash component allowing easy integration of thousands of icons from the Iconify ecosystem.
- Dash Extensions [python][dash][advanced]: Collection of utilities and advanced components for Dash including WebSocket support, serverside callbacks and performance improvements.
- Dash Leaflet [python][dash][maps]: Leaflet map components for Dash, useful for building interactive geospatial dashboards.
- Dash AG Grid [python][dash][tables][big-data]: Advanced interactive data grid component for Dash supporting sorting, filtering, virtualization and large datasets.
- Dash Cytoscape [python][dash][networks]: Graph visualization component for displaying networks and node-link diagrams.
- Dash Daq [python][dash][scientific-UI]: Specialized components for scientific and engineering dashboards such as gauges, knobs and instrument displays.
- Dash Labs [python][dash][experimental]: Experimental features and utilities for simplifying Dash app development.
- Dash Tools [python][dash][workflow]: Utilities to simplify Dash project structure and development workflow.
Useful additions
- Dash VTK [python][dash][VTK][3D]: Components for interactive 3D visualization of VTK datasets directly inside Dash applications.
- Dash Deck [python][dash][WebGL][maps]: Dash wrapper around Uber’s Deck.gl library, allowing high-performance WebGL visualizations for large geospatial datasets.
- Dash Draggable [python][dash][layout]: Enables draggable and resizable dashboard layouts, useful for building customizable analytical interfaces where users can rearrange charts and panels.
- Dash Split Pane [python][dash][layout]: Provides resizable split panels for Dash layouts, making it easy to build interfaces with adjustable visualization panels or side-by-side data views.
- Dash Ace [python][dash][editor]: Embeds the Ace code editor inside Dash apps, useful for building interactive notebooks, parameter editors, or user-defined scripts directly in dashboards.
Other Python dashboard frameworks
- Panel [python][dashboards]: Python framework for building interactive dashboards and data applications, often used together with Holoviews, Bokeh and Datashader.
- Streamlit [python][dashboards][rapid-prototyping]: Very popular framework for quickly turning Python scripts into interactive data apps with minimal code.
- Trame [python][VTK][dashboards][3D]: Framework for building interactive web applications around VTK, ParaView and PyVista visualizations, particularly suited for scientific computing and 3D visualization.
Other useful tools
- EPW [python][weather-files][EPW]: Lightweight Python package for editing EnergyPlus Weather (
epw) files — very convenient for reading and parsing EPW datasets.
Geek tools ⚙️
ASCII art
- ASCIIFlow [ASCII][diagrams]: Browser-based editor for drawing diagrams using ASCII characters — perfect for quick terminal-style sketches.
- Text to ASCII Art Generator [ASCII][text]: Type your text and generate ASCII banners in many styles.
. __  __       _
 |  \/  |     | |
 | \  / | __ _| |_ ___ _   _ ___ ____
 | |\/| |/ _` | __/ _ \ | | / __|_  /
 | |  | | (_| | ||  __/ |_| \__ \/ /
 |_|  |_|\__,_|\__\___|\__,_|___/___|
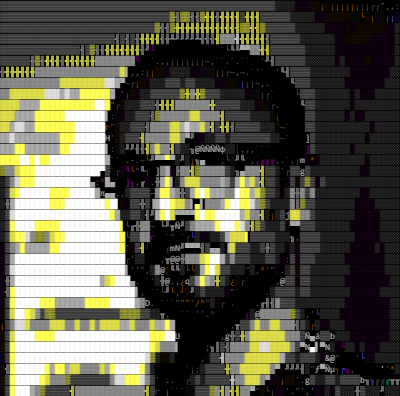
- ASCII Art Generator [ASCII][images]: Convert images into ASCII art.
- asciichart [ASCII][charts][terminal]: Small library that plots time series directly in the terminal using ASCII characters.
 10 ┤      ╭╮
  9 ┤     ╭╯╰╮
  8 ┤    ╭╯  ╰╮
  7 ┤   ╭╯    ╰╮
- text-img [terminal][screenshots]: Convert text to styled terminal-like screenshots.
- asciinema [terminal][recording]: Record and share terminal sessions as lightweight interactive animations.
Developer utilities
- Carbon [code][screenshots]: Create beautiful images of source code for documentation, blog posts, or presentations, with customizable themes and syntax highlighting.
- Ray.so [code][screenshots]: Lightweight tool to generate stylish images from code snippets, useful for sharing code examples in articles or slides.
- JSON Crack [JSON][visualization]: Interactive tool to visualize JSON structures as expandable graphs, making it easier to explore complex nested data.
- Mermaid Live Editor [diagrams][editor]: Online editor for generating diagrams (flowcharts, sequence diagrams, Gantt charts, etc.) from a simple Markdown-like syntax.
- TableConvert [tables][conversion]: Handy utility to convert tables between many formats including CSV, Markdown, JSON, SQL, HTML, and Excel.
- Explain Shell [CLI][learning]: Displays the meaning of each part of a Unix shell command by matching it with the corresponding manual page documentation.
Terminal theming & shell tools
- terminal.sexy [terminal][colors][themes]: Terminal color scheme designer that lets you create, preview and export themes for many terminal emulators.
- Gogh [terminal][themes][Linux]: Large collection of terminal color schemes for Gnome Terminal and other Linux terminals, with easy installation scripts.
- dircolors-gen [terminal][LS_COLORS][Linux]: Generator for
LS_COLORSthemes, useful for customizing file and directory colors across shells and terminal emulators. - Starship [prompt][shell][cross-platform]: Fast and highly customizable cross-shell prompt for Bash, Zsh, Fish, PowerShell and more.
- Oh My Zsh [shell][zsh][productivity]: Community-driven framework for managing Zsh configuration, themes and plugins.
- Oh My Posh [prompt][shell][Windows]: Prompt theme engine for Bash, Zsh, Fish, PowerShell and CMD, particularly popular for polished cross-platform terminal setups.
- shell-color-prompt-tool [bash][zsh][prompt]: Interactive command-line tool for building and customizing colored Bash and Zsh prompts.
- synth-shell [shell][prompt][Linux]: Customizable shell prompt with useful context information, multiple themes and a polished Linux-terminal aesthetic.
- windows-terminal-theme-generator [Windows][terminal][themes]: Tool for generating and previewing custom Windows Terminal themes.
- windows-terminals [Windows][terminal][themes]: Repository collecting many ready-to-use themes for Windows Terminal.