Mateusz BOGDAN
My personal site, with a short presentation of who I am, my academic and professional activities and research interests !
~ $ datavisualisation
Through my work, and because i like this kind of stuff, I often have to produce some “nice” visualisations. You’ll find below some examples and (data-)visualization “researches” !
Mostly made with #Paraview and / or #Python, and sometimes by hand !
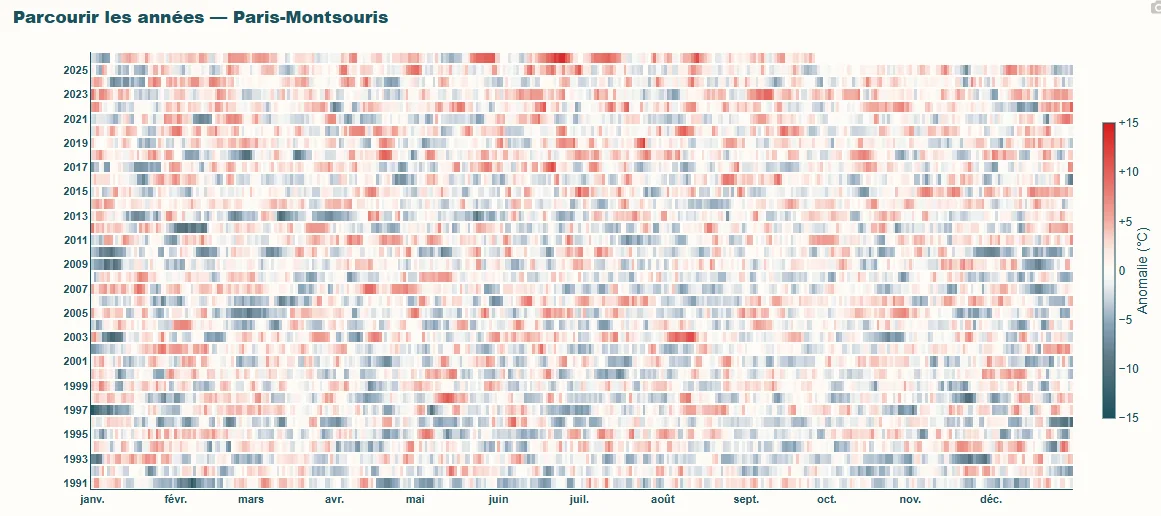
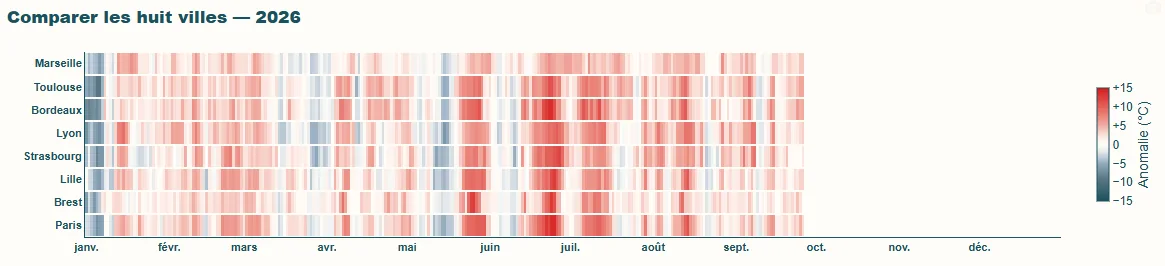
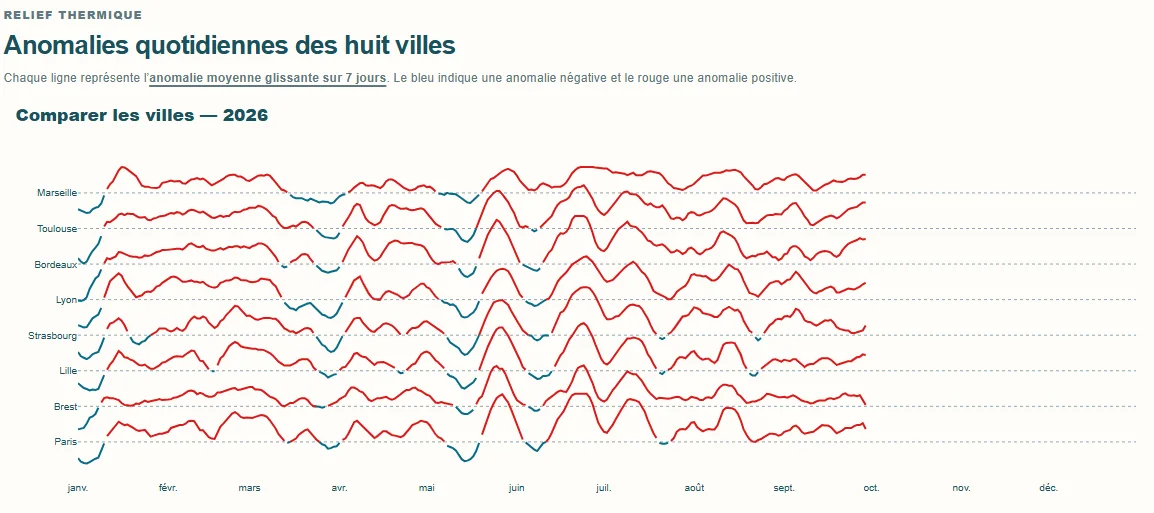
Temperature anomalies // Visual research
[2026]
Three visual explorations of temperature anomalies relative to a reference period: a year-by-year calendar, a comparison between cities, and a thermal-relief view. They were developed alongside the Temperature anomalies web app.
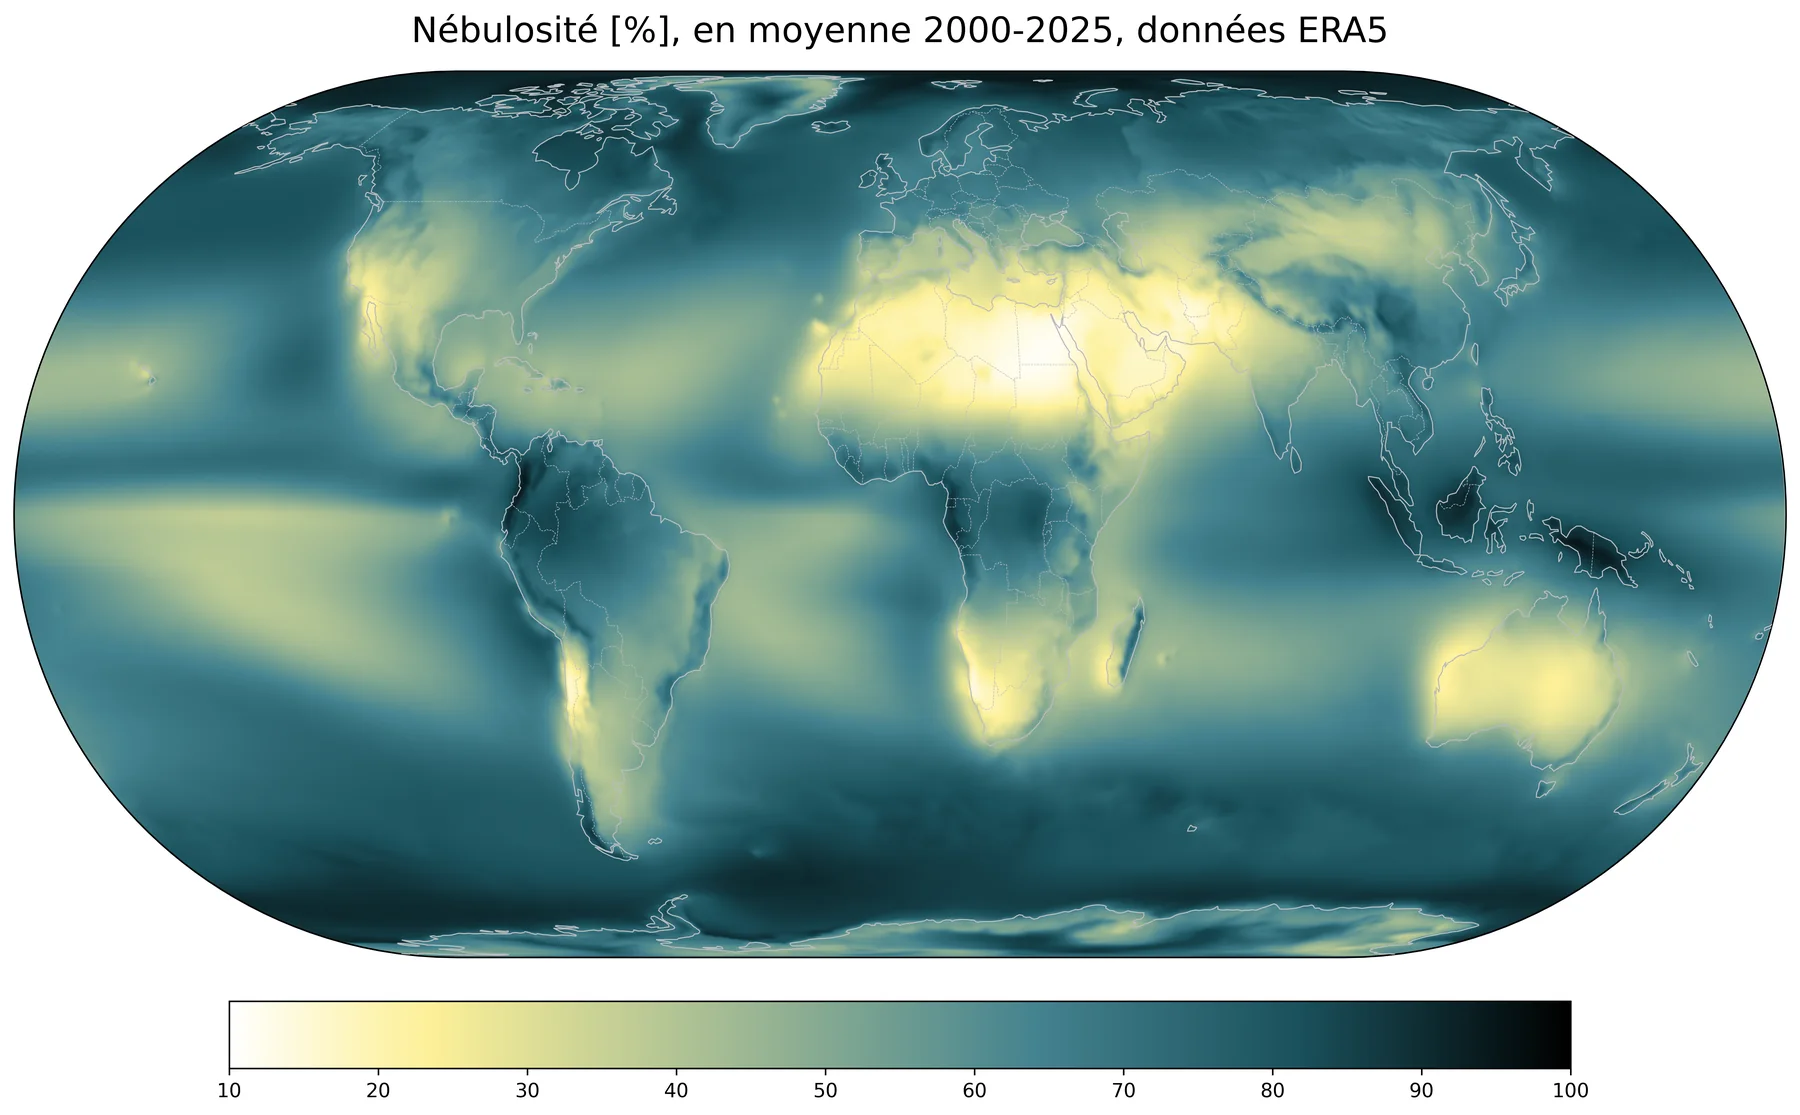
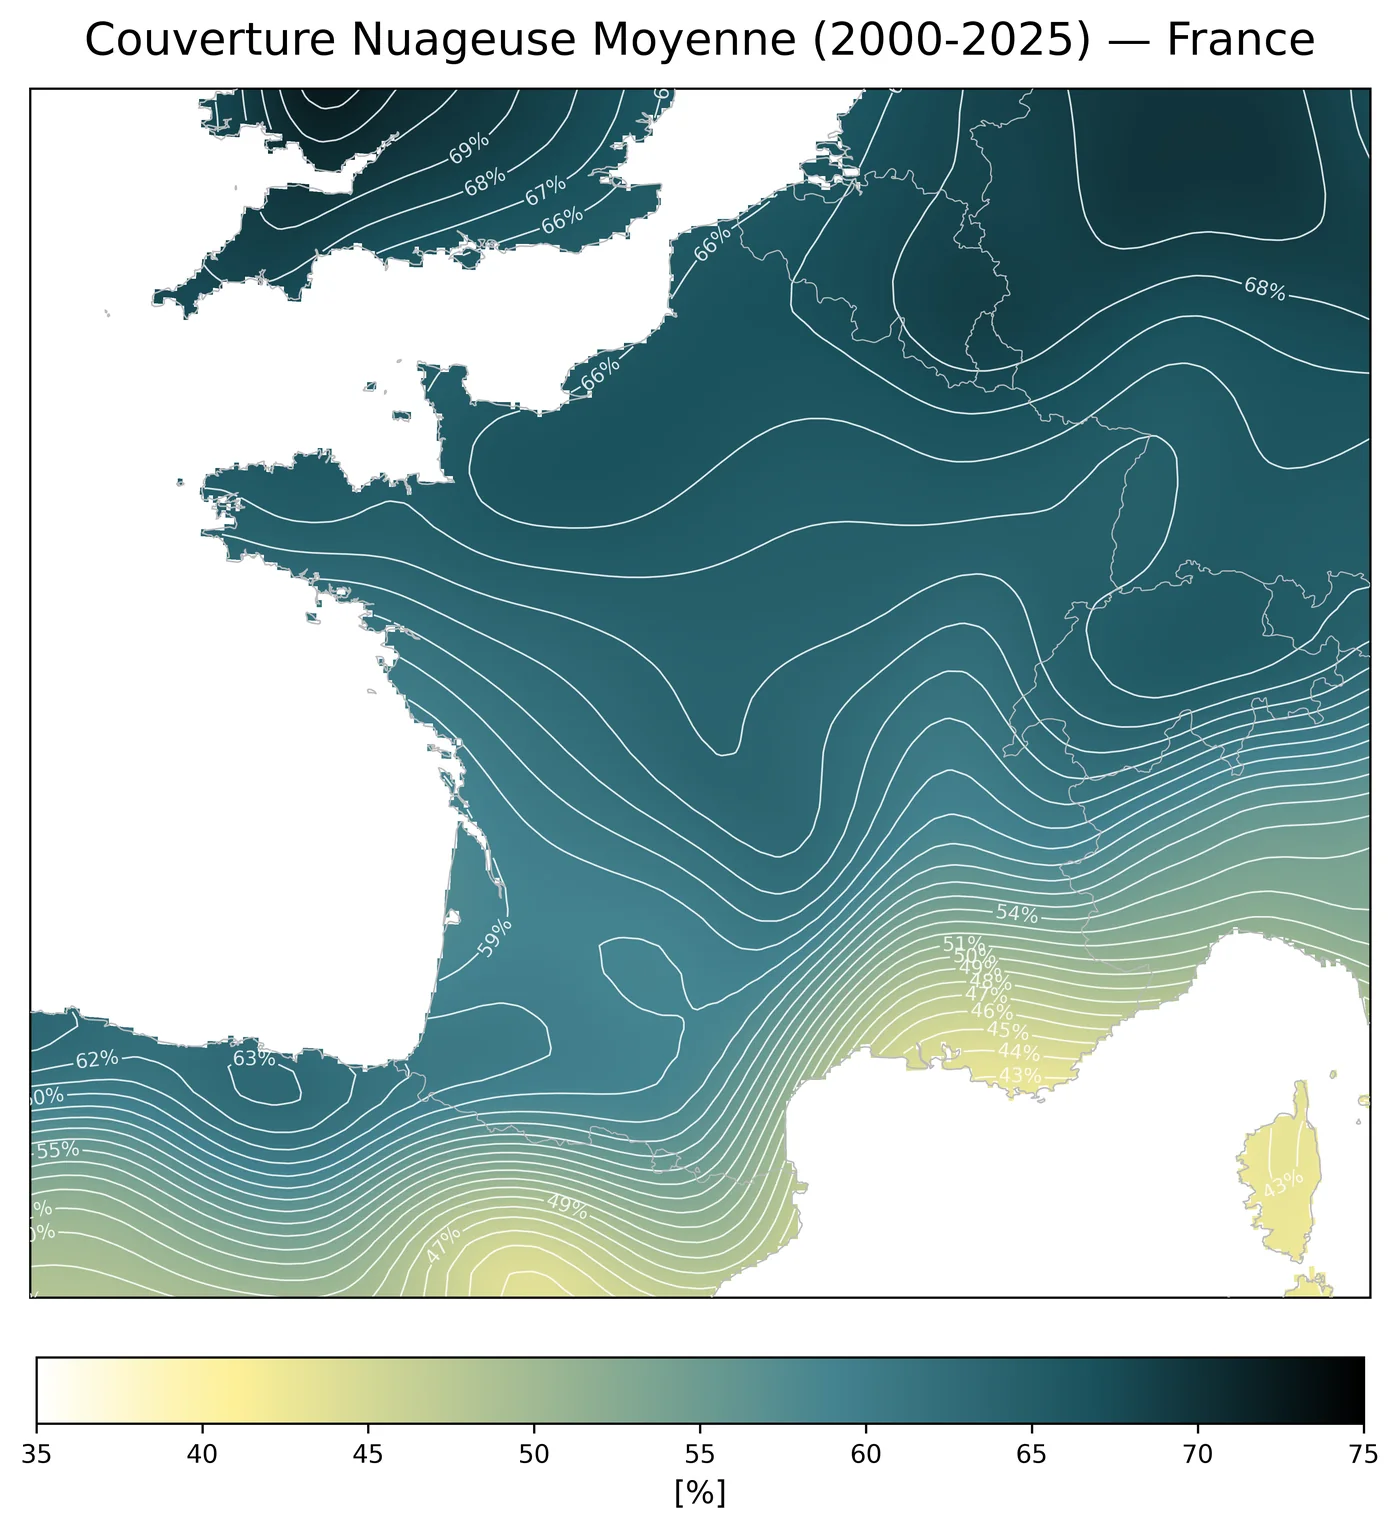
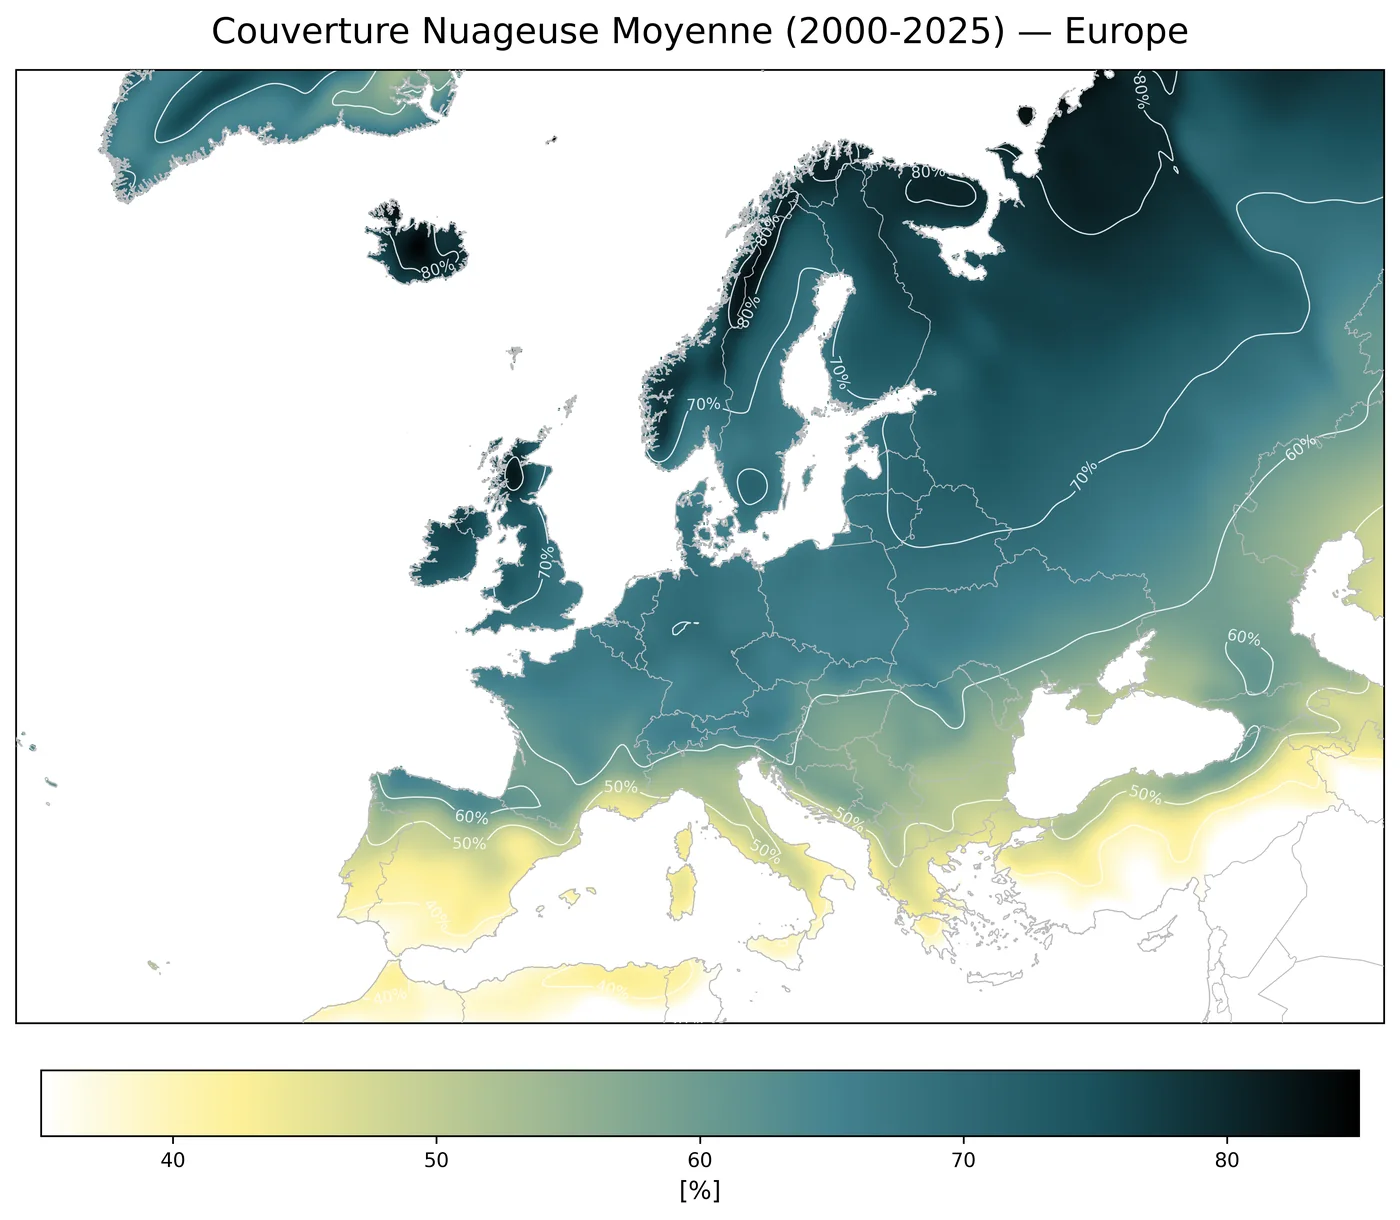
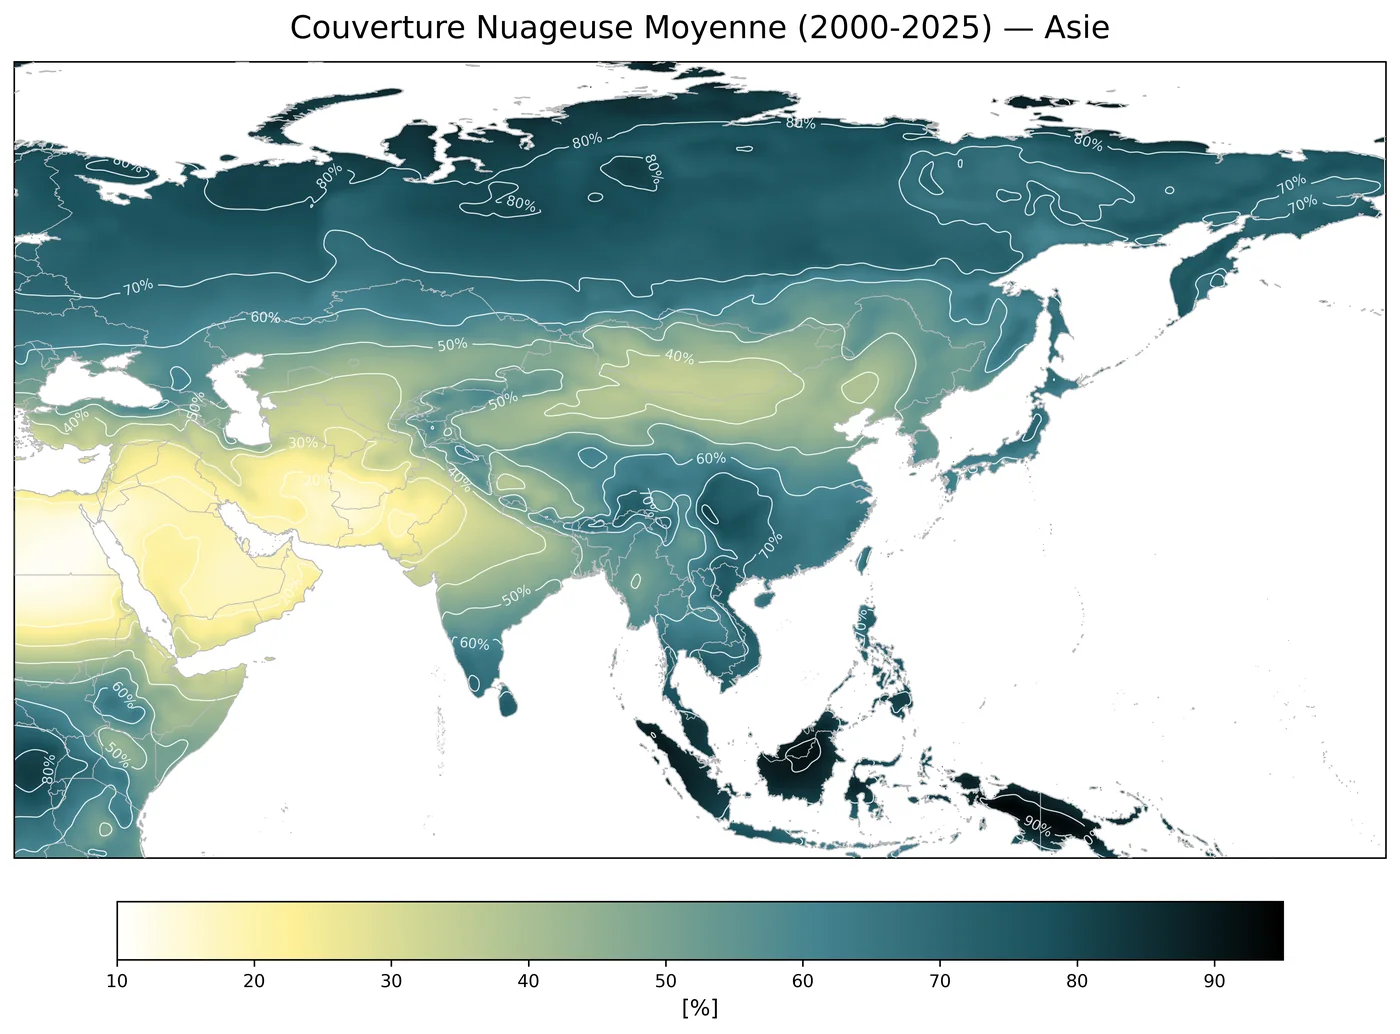
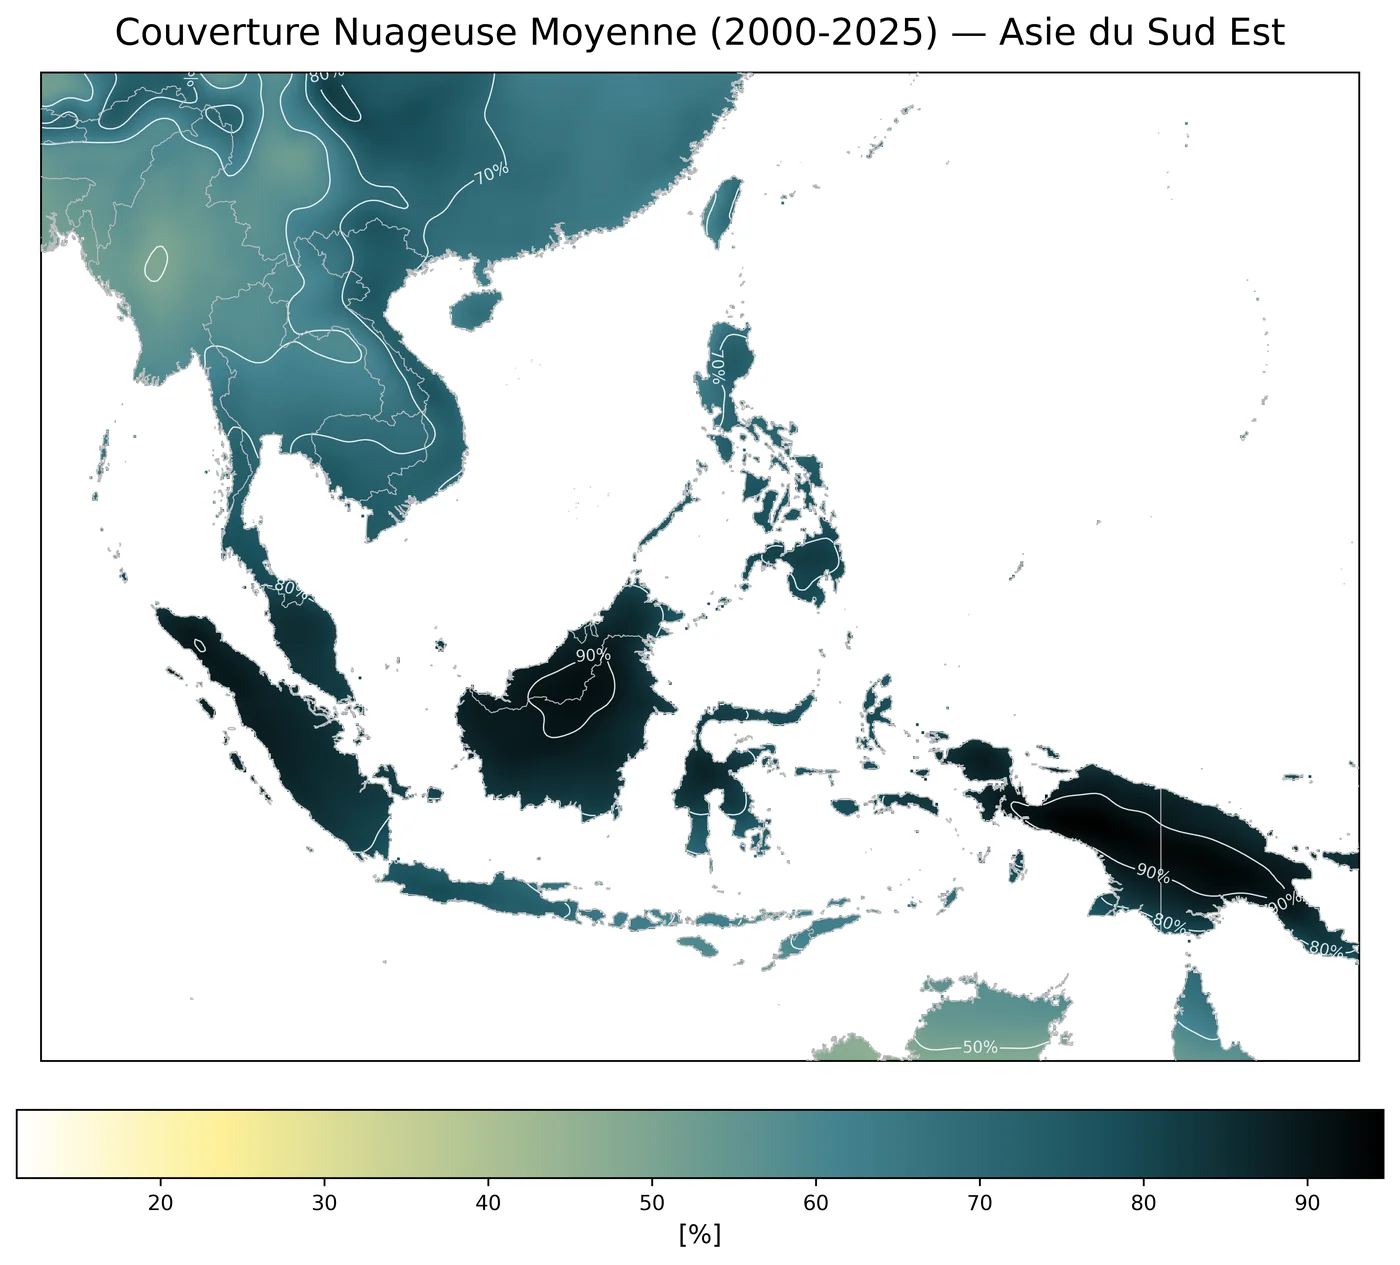
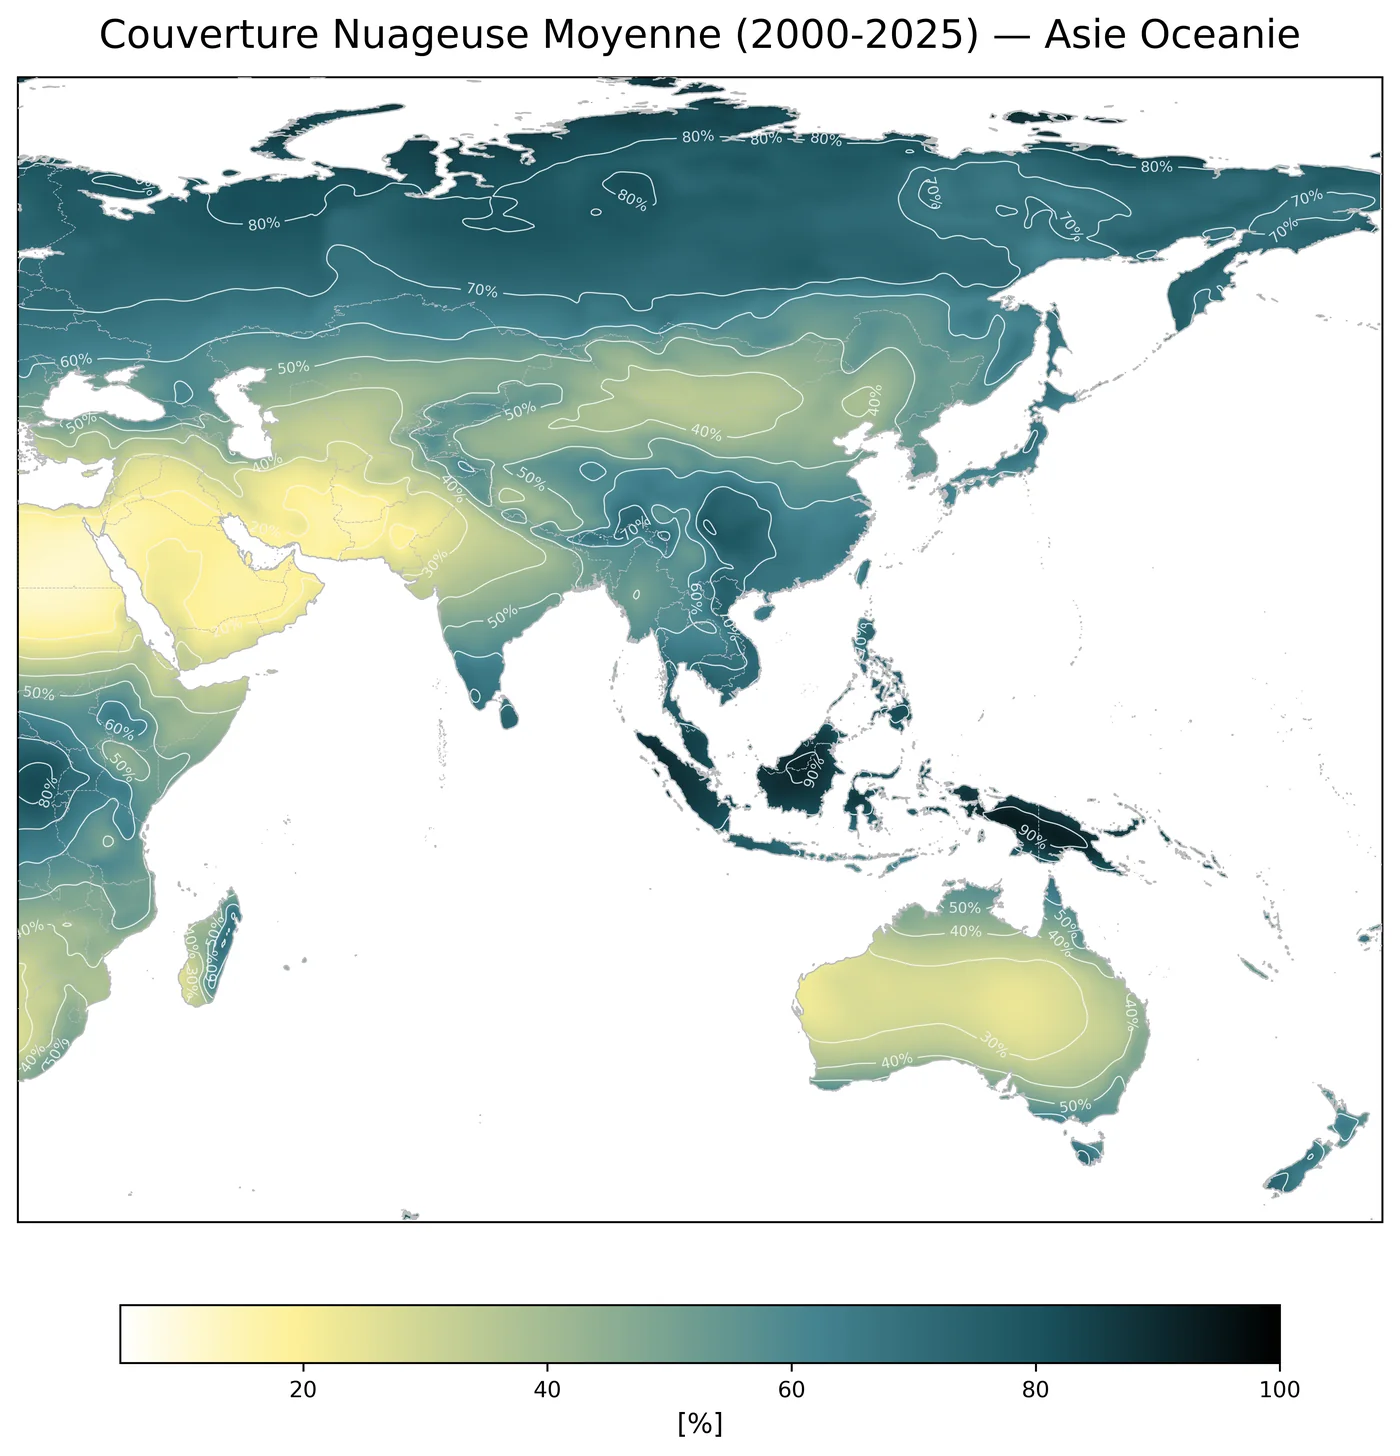
Mean cloud cover // ERA5
[Summer 2026]
Mean cloud cover mapped at global and regional scales from ERA5 data averaged over the 2000–2025 period. These visualisations were created for an internal AREP Gazette.
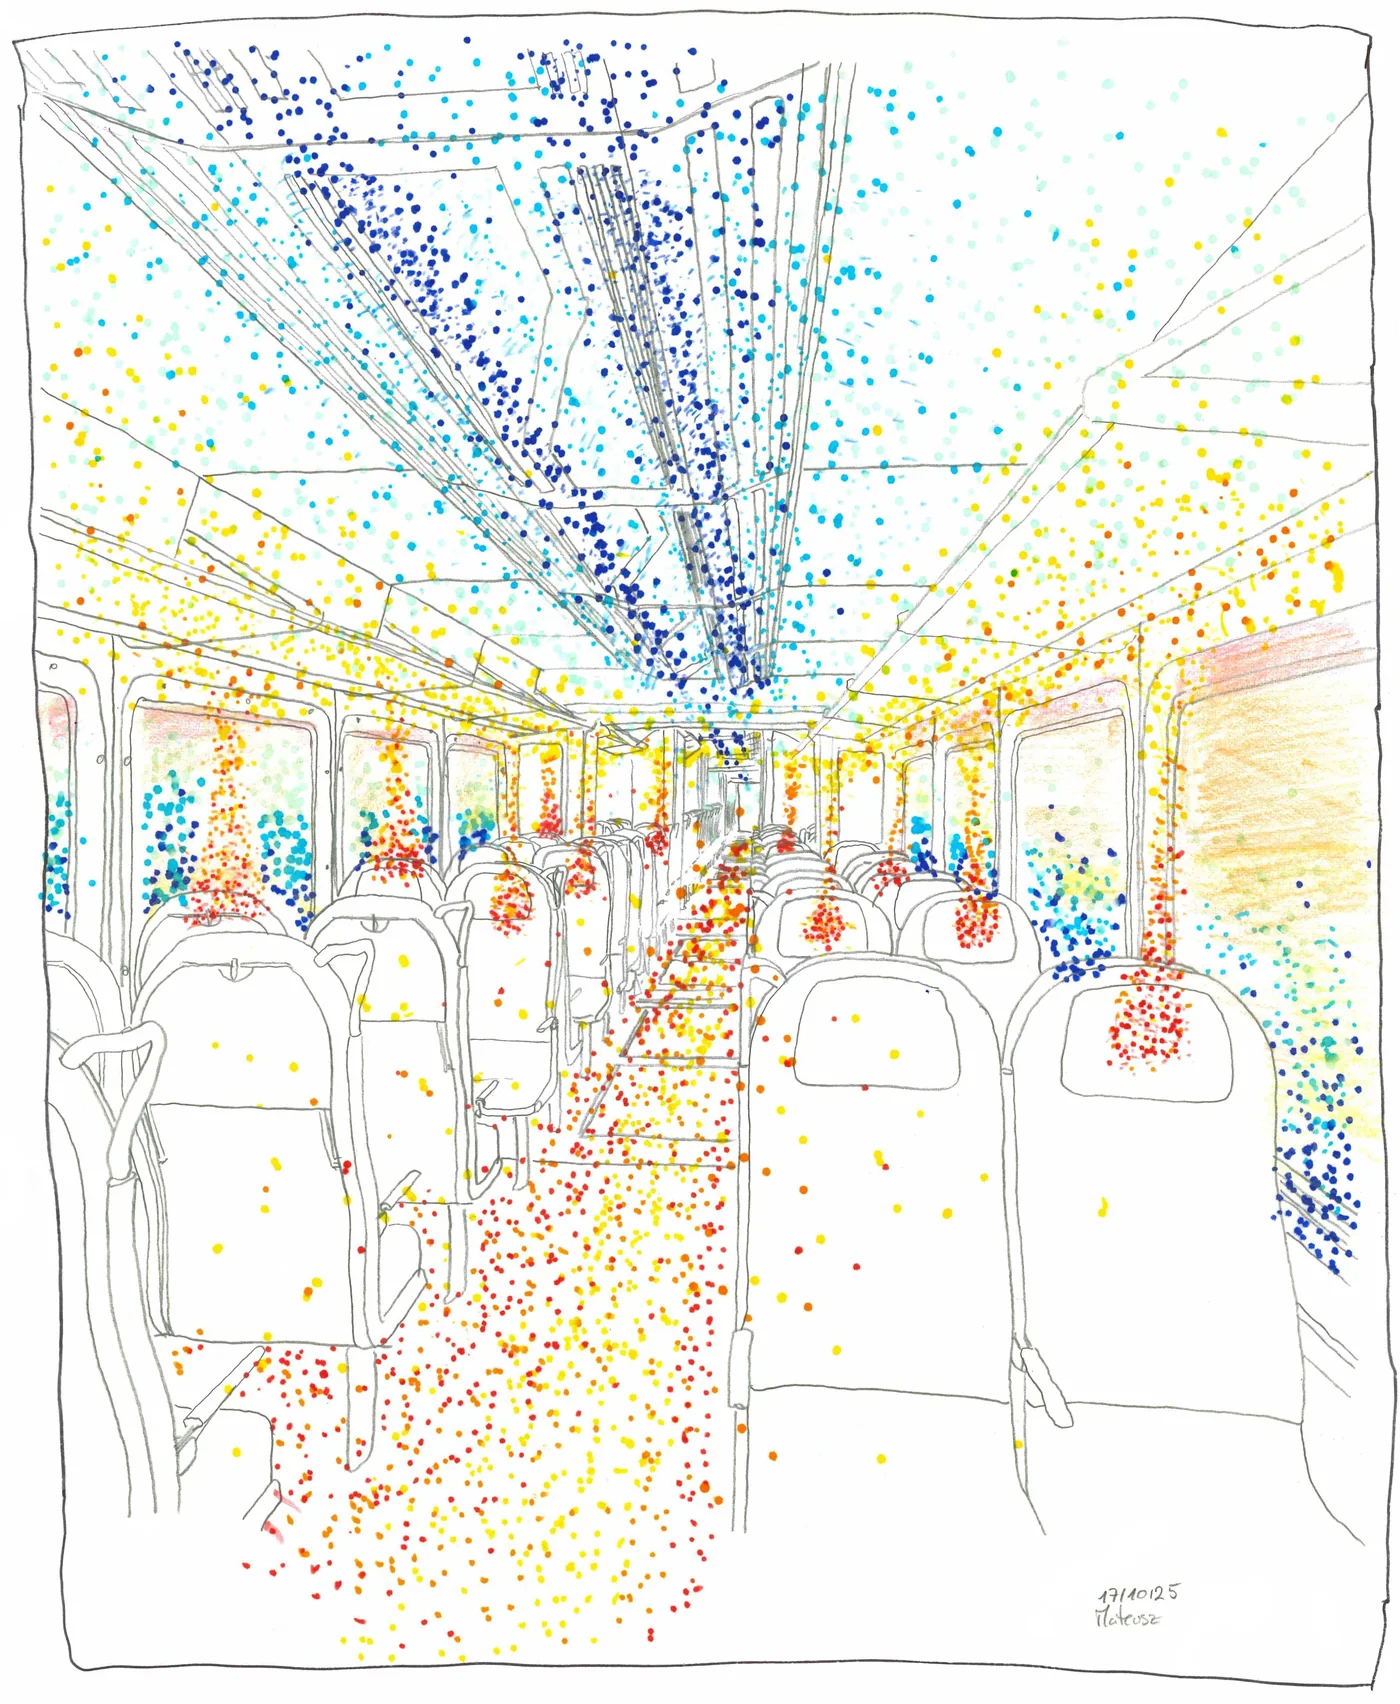
Representing thermal comfort // Hand drawing
[10.2025]
A hand-drawn exploration made during an internal AREP workshop on ways to represent thermal comfort and its spatial variations inside a train.
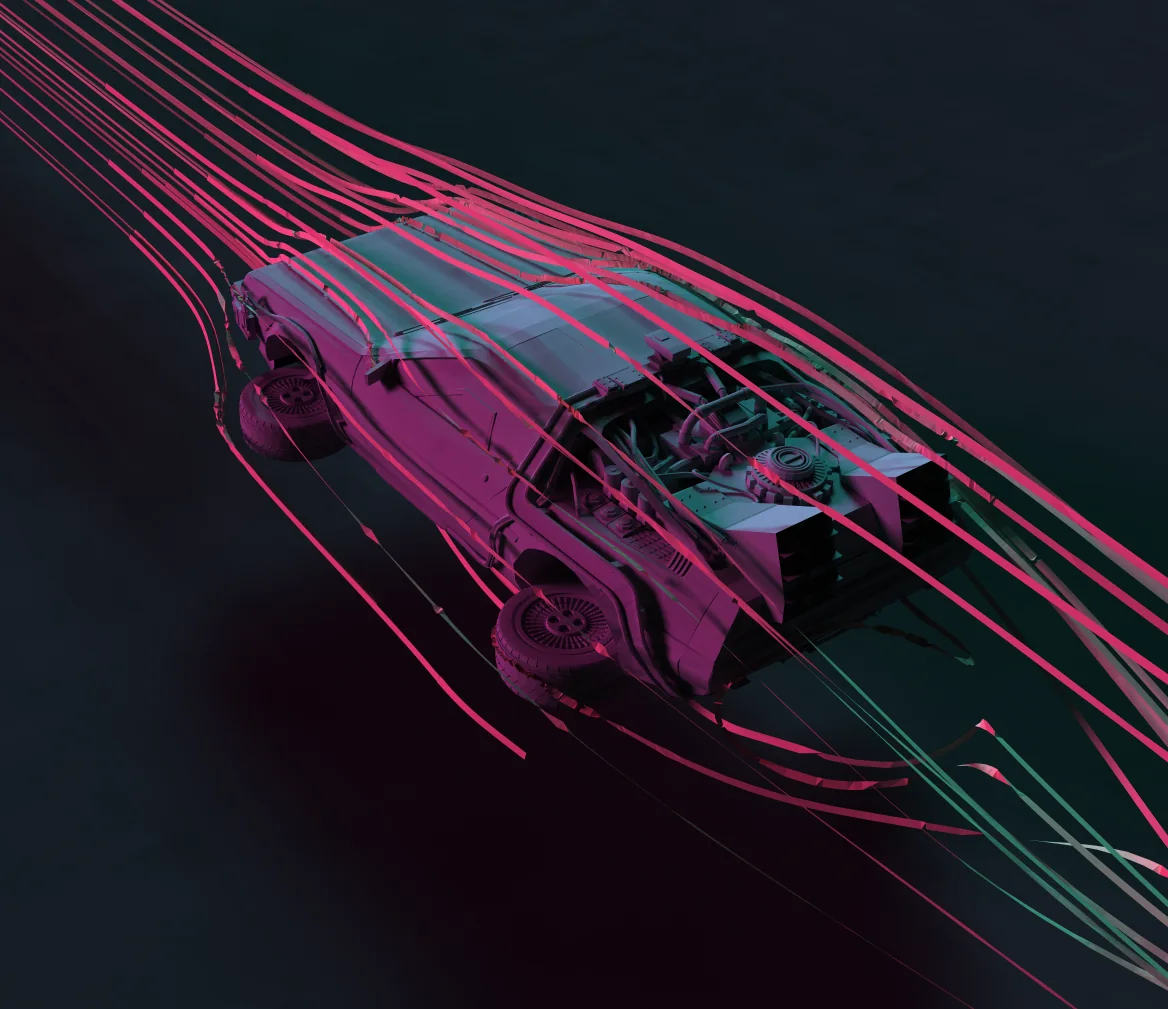
Doc’s DeLorean // OpenFOAM // Paraview
[2025]
This one was just to play around with a nice STL file I found on the web.
- I cleaned a little bit the geometry,
- I set up a quick case in OpenFOAM,
- Run a quick steady state computation,
- Played around with Paraview
Underground Winds
[2024]
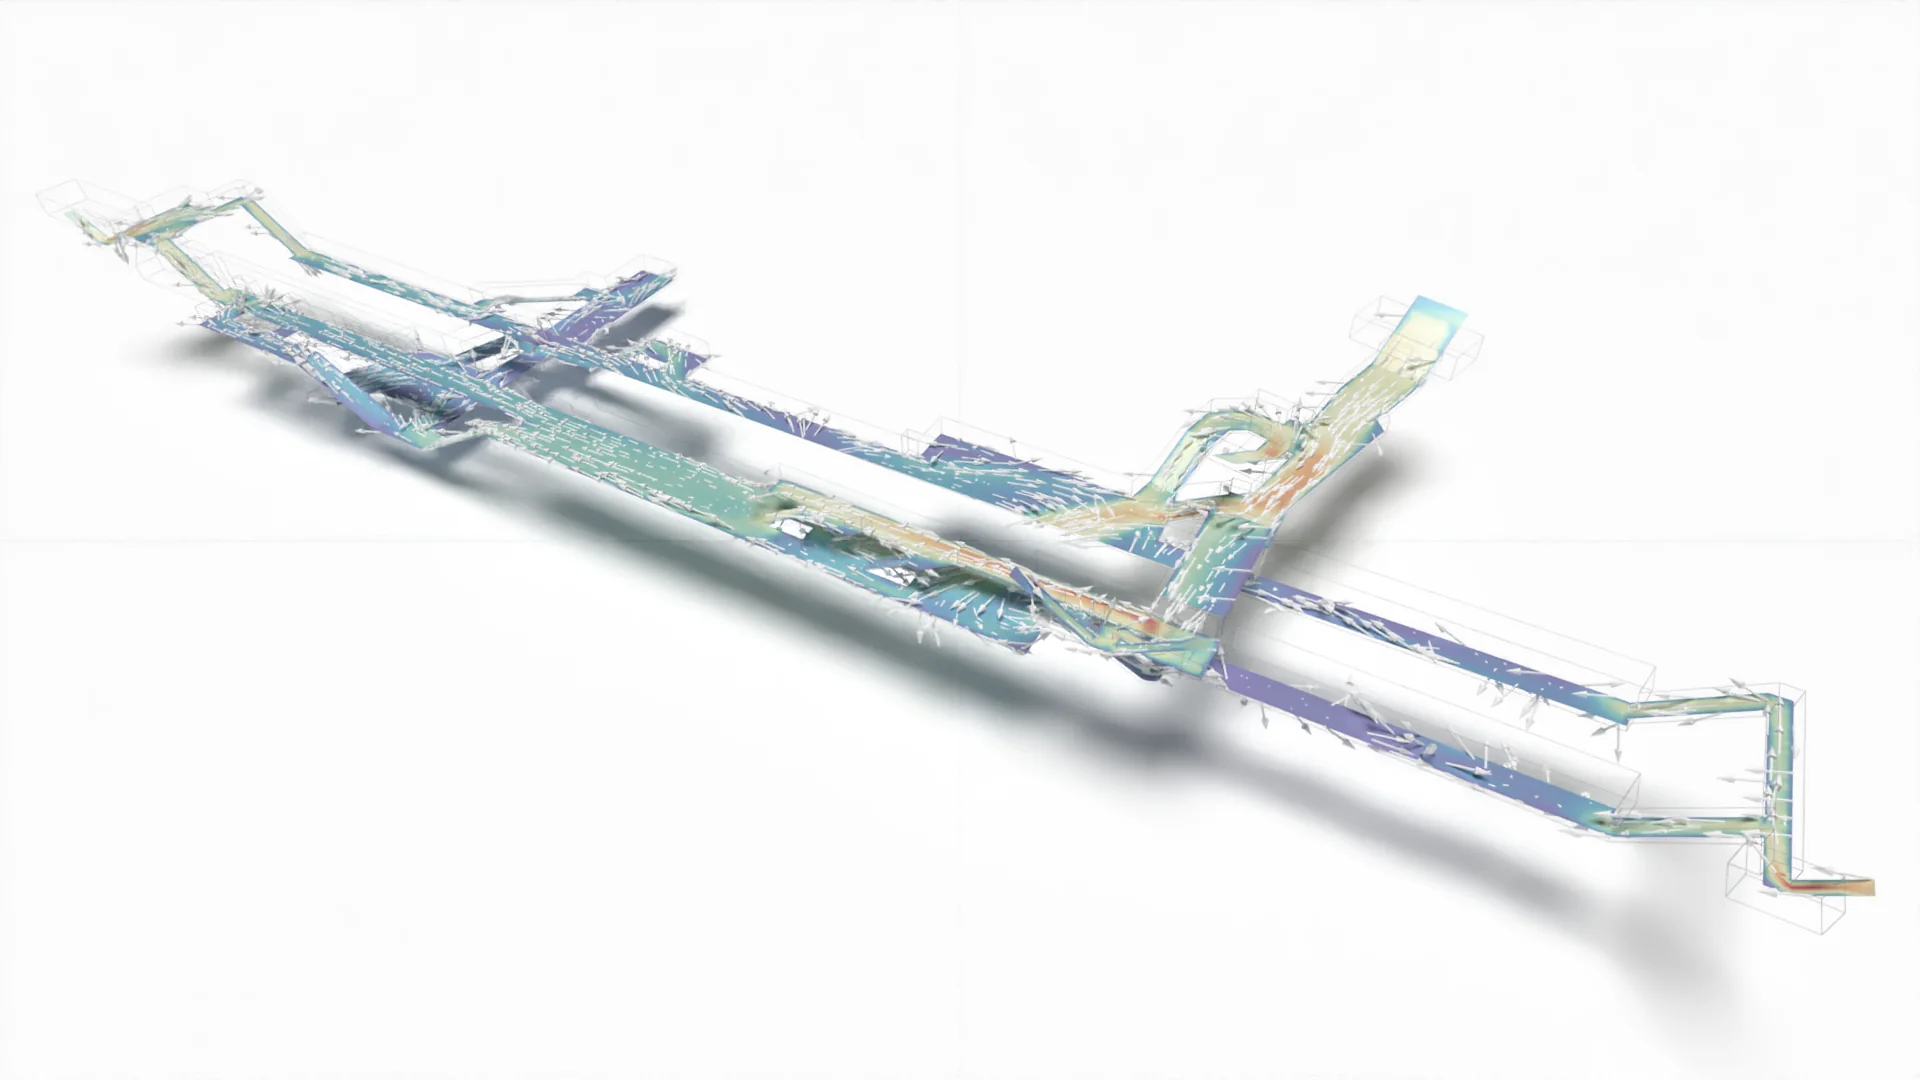
I made those simulation for a project at AREP (more information)
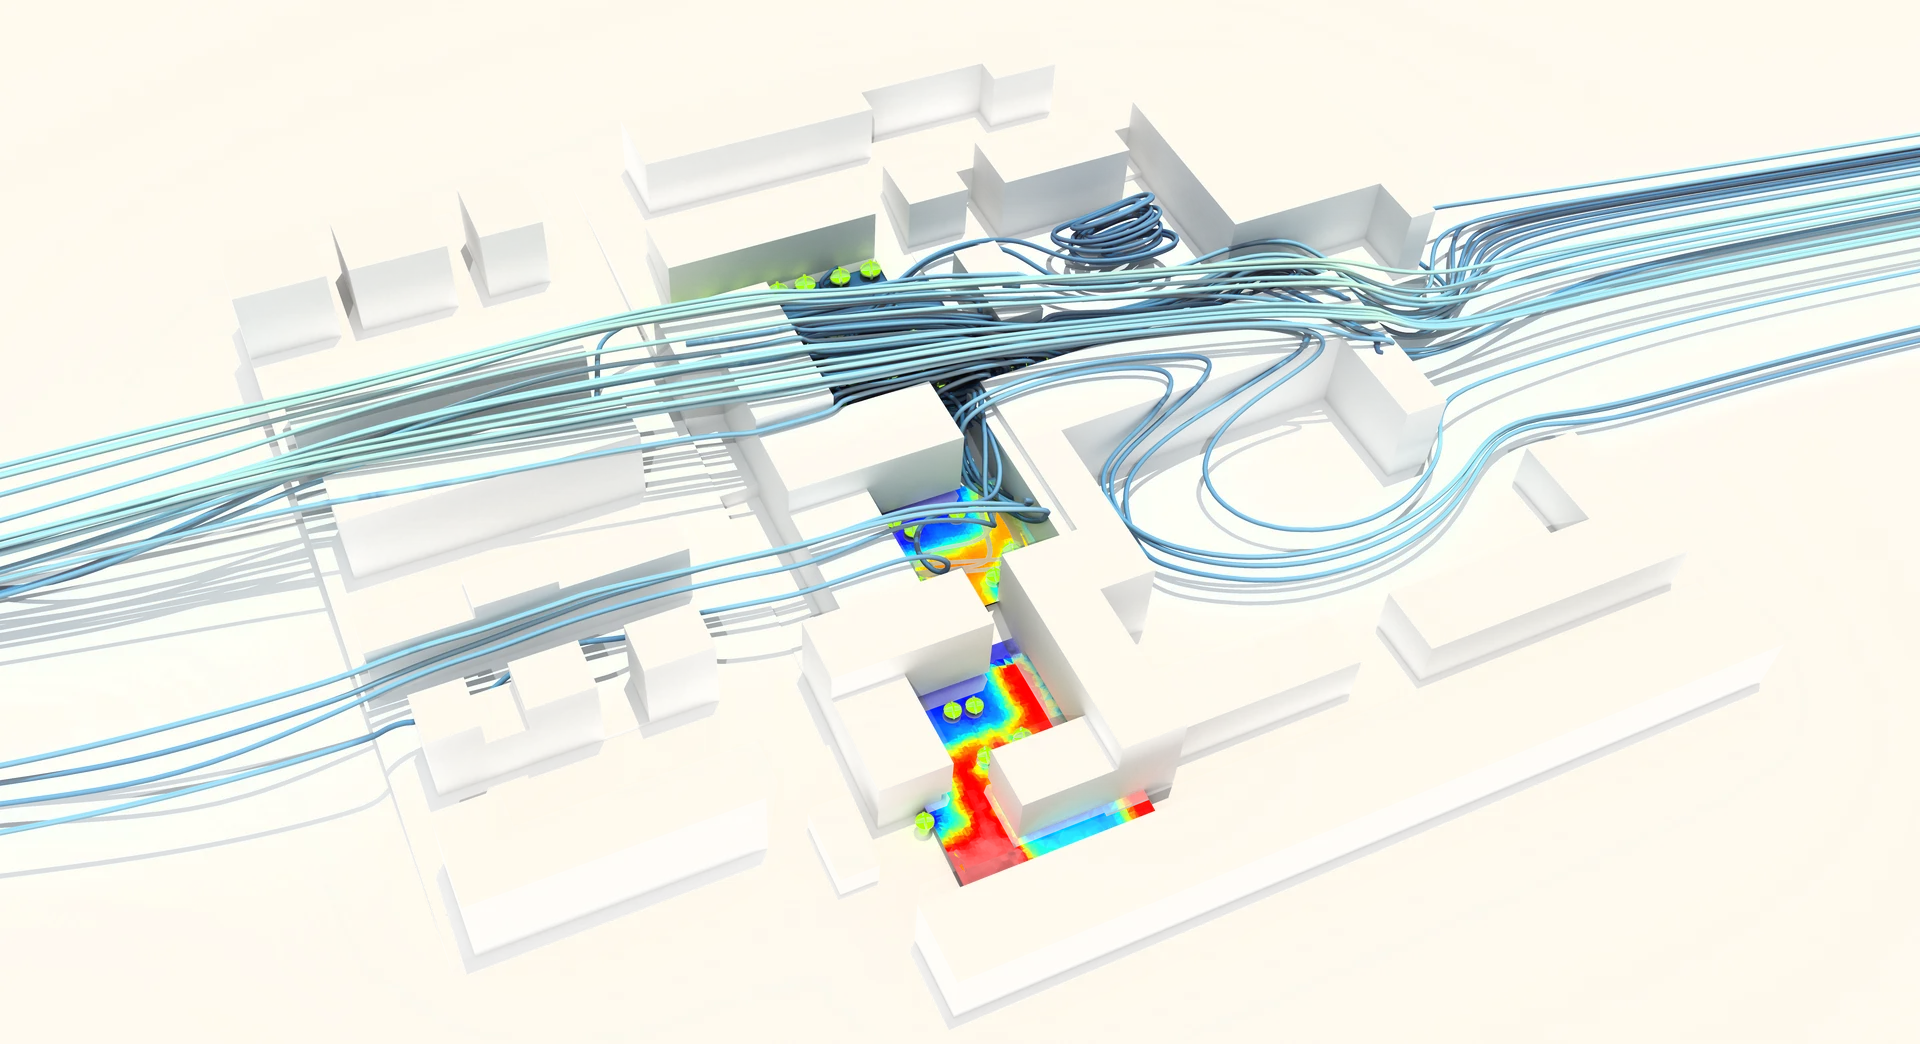
- Dynamic CFD simulation of a train entering an underground train station (train not on the picture)
- Study of airflow induced by train movements in an underground station
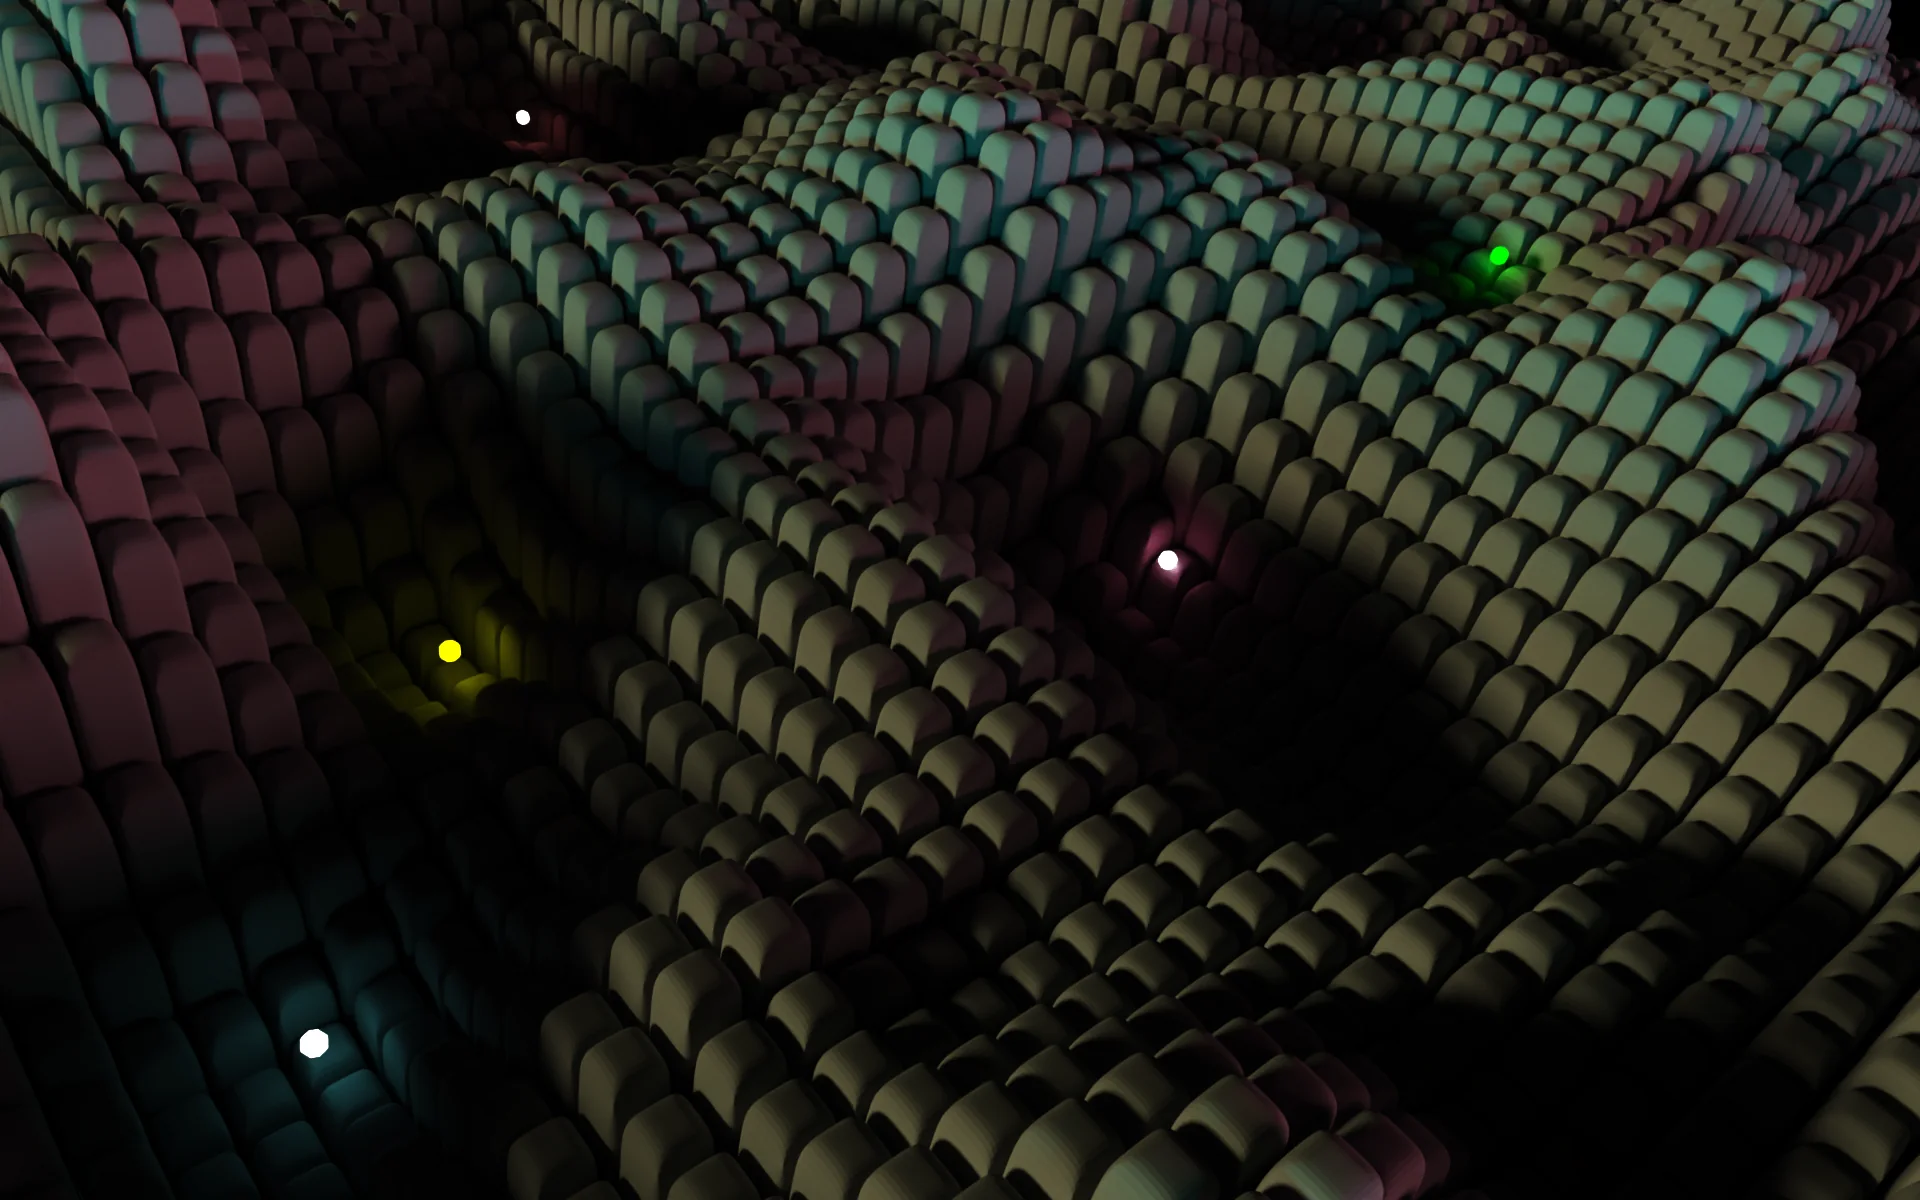
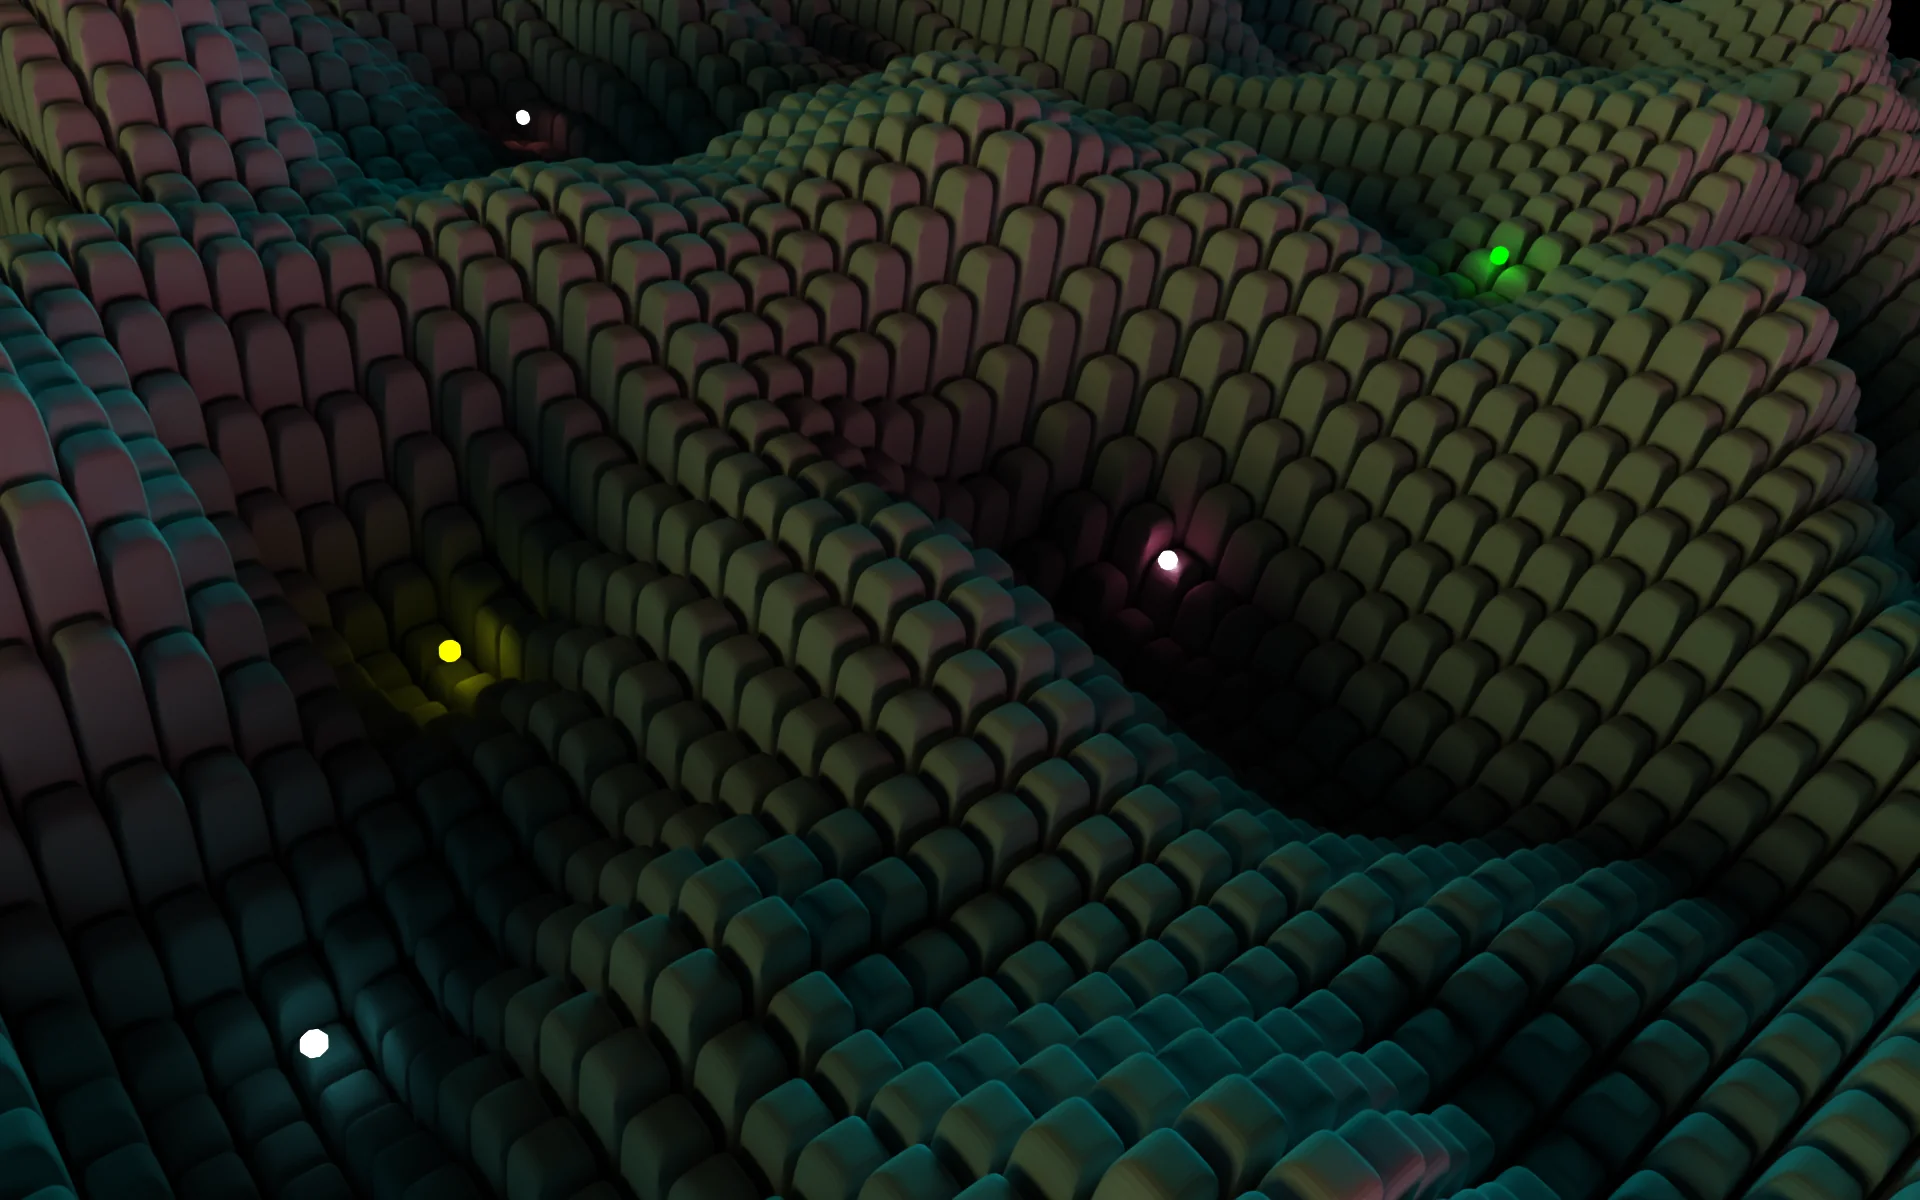
Perlin Noise // Paraview Ray Tracing and lightning capabilities
[2023]
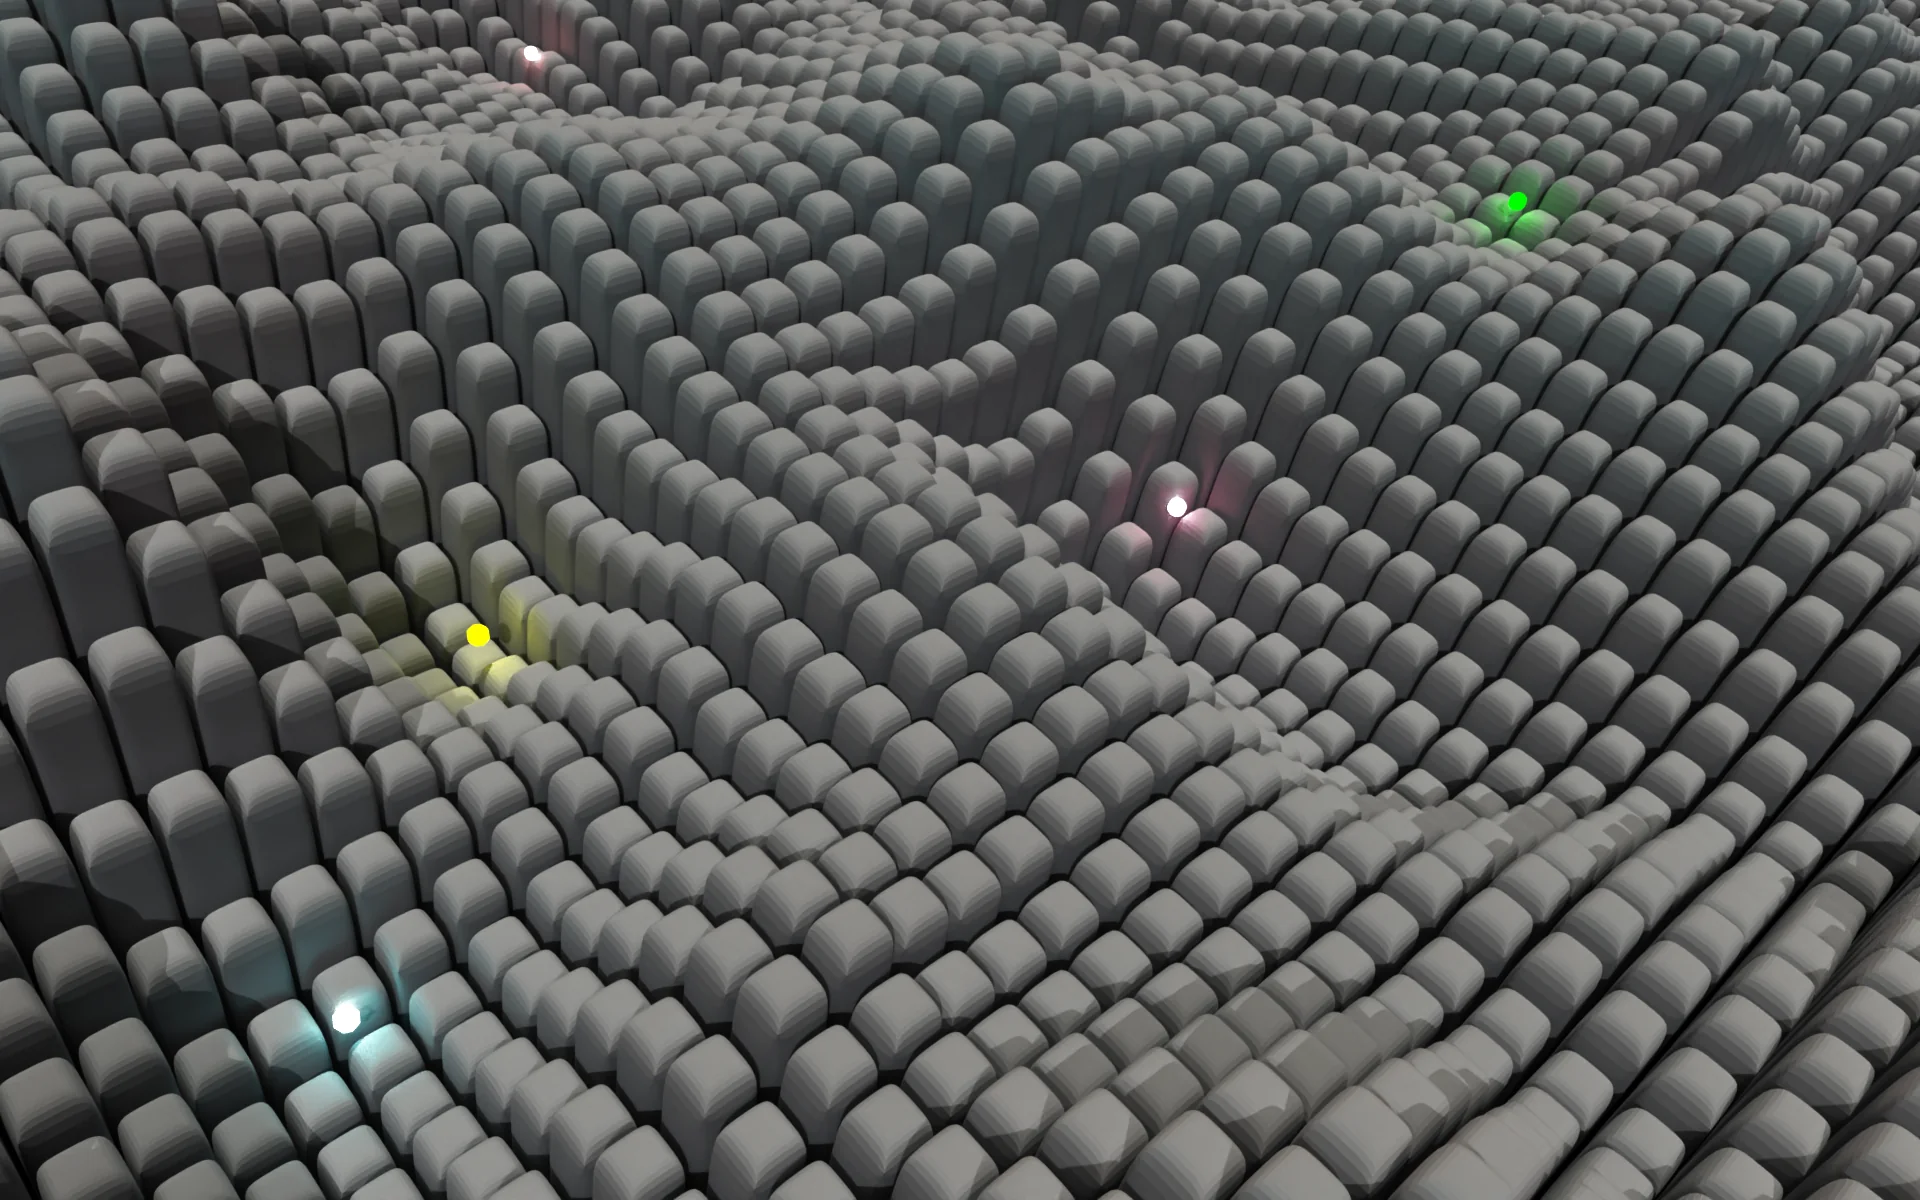
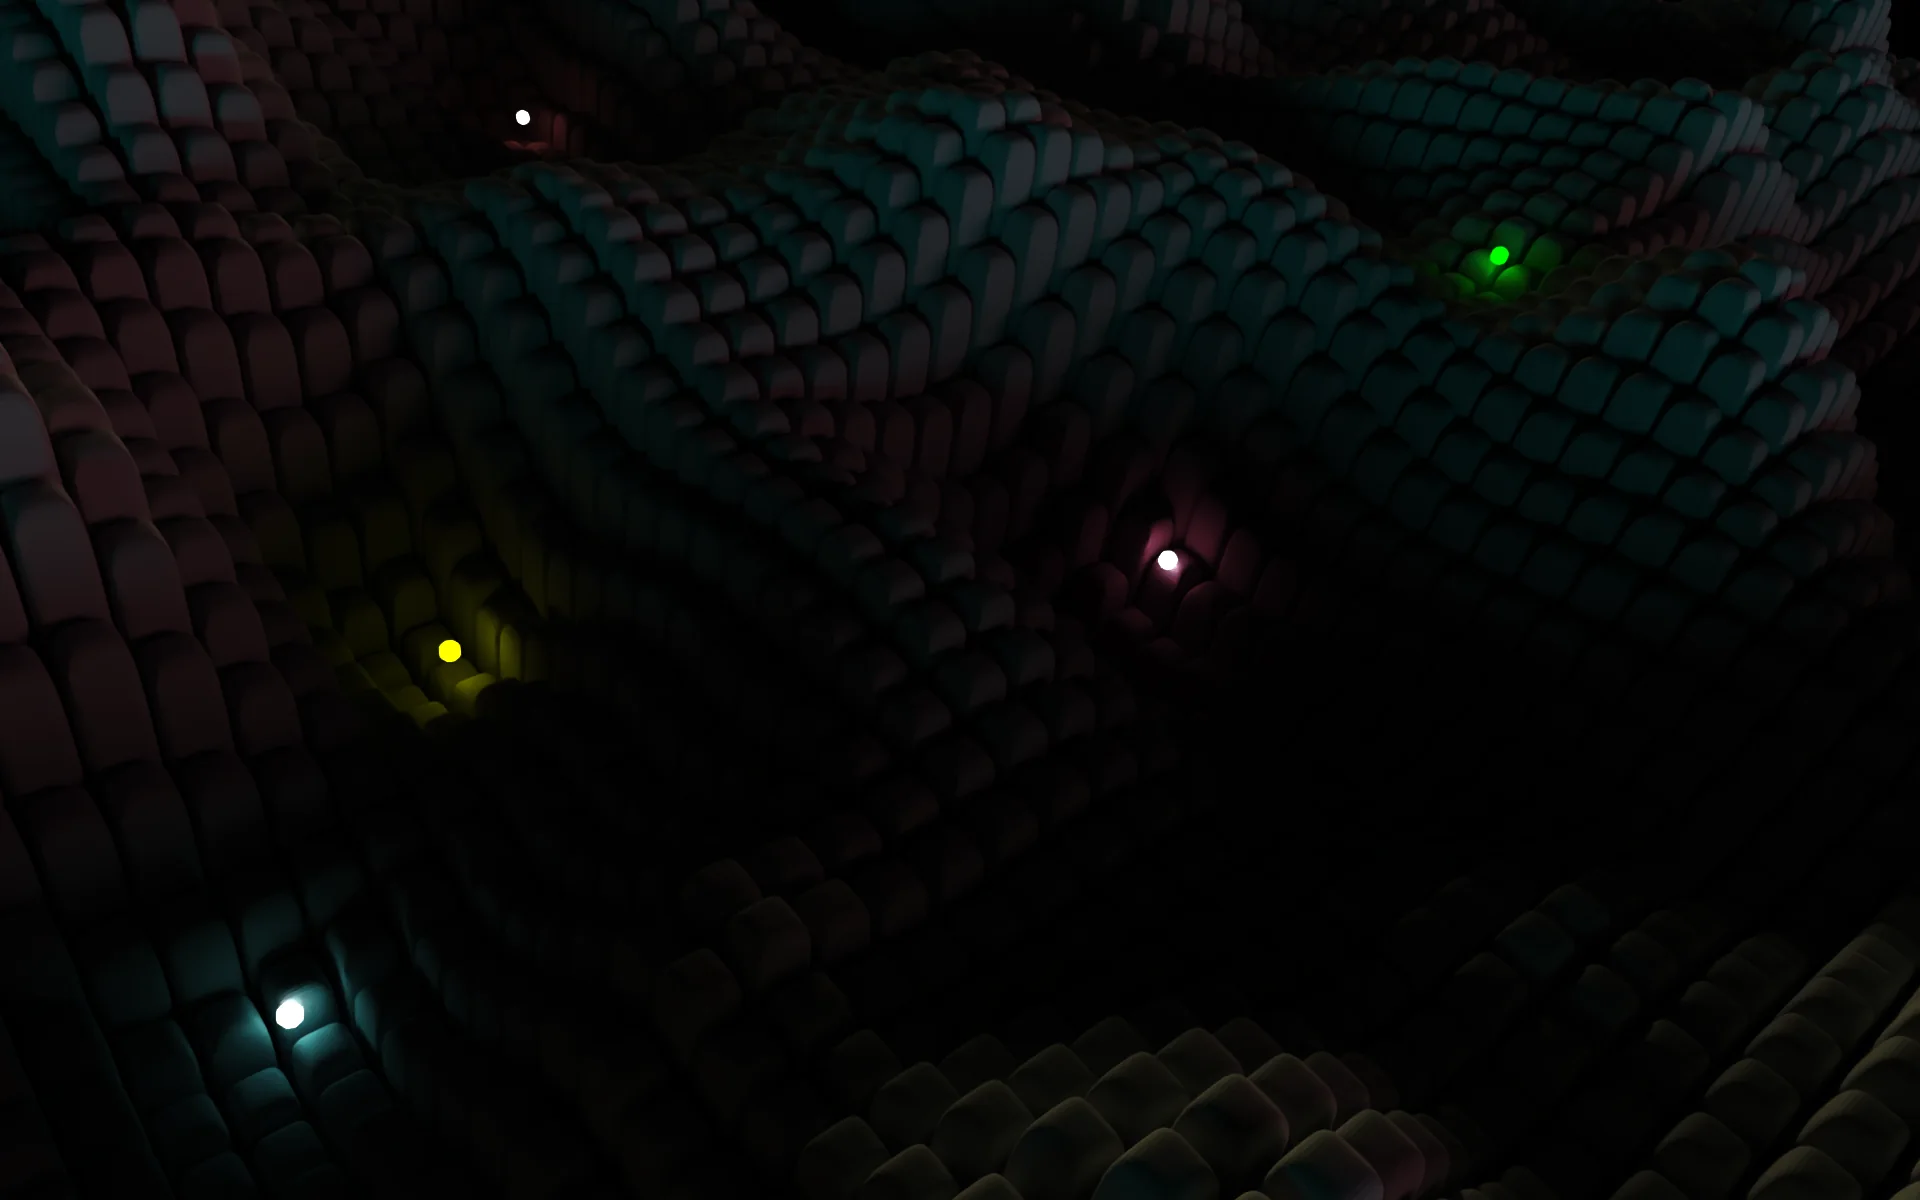
I’ve been playing with Python and Paraview, to test light sources within the scene :
- Generate a 3D geometry of bars, with heigths following a Perlin noise (a sort of pseudo-correlated random field)
- Play with ligths in Paraview that are outside the scene,
- Finally add sources within the scene, et voilà !
Energy demands // Paraview Animation
[05.2023]
I played with Python, Geopandas, and Paraview :
- Took an opendata (I lost the precise reference) for energy demand in France
- Generated an actual STL file reprensenting the map below with Geopandas, for few years (2017-2019).
- Set up my scene in Paraview, with colors, lignthing and some text
- Get the animation runnnig !

Indoor Thermal Comfort // Fans
[12.2023]
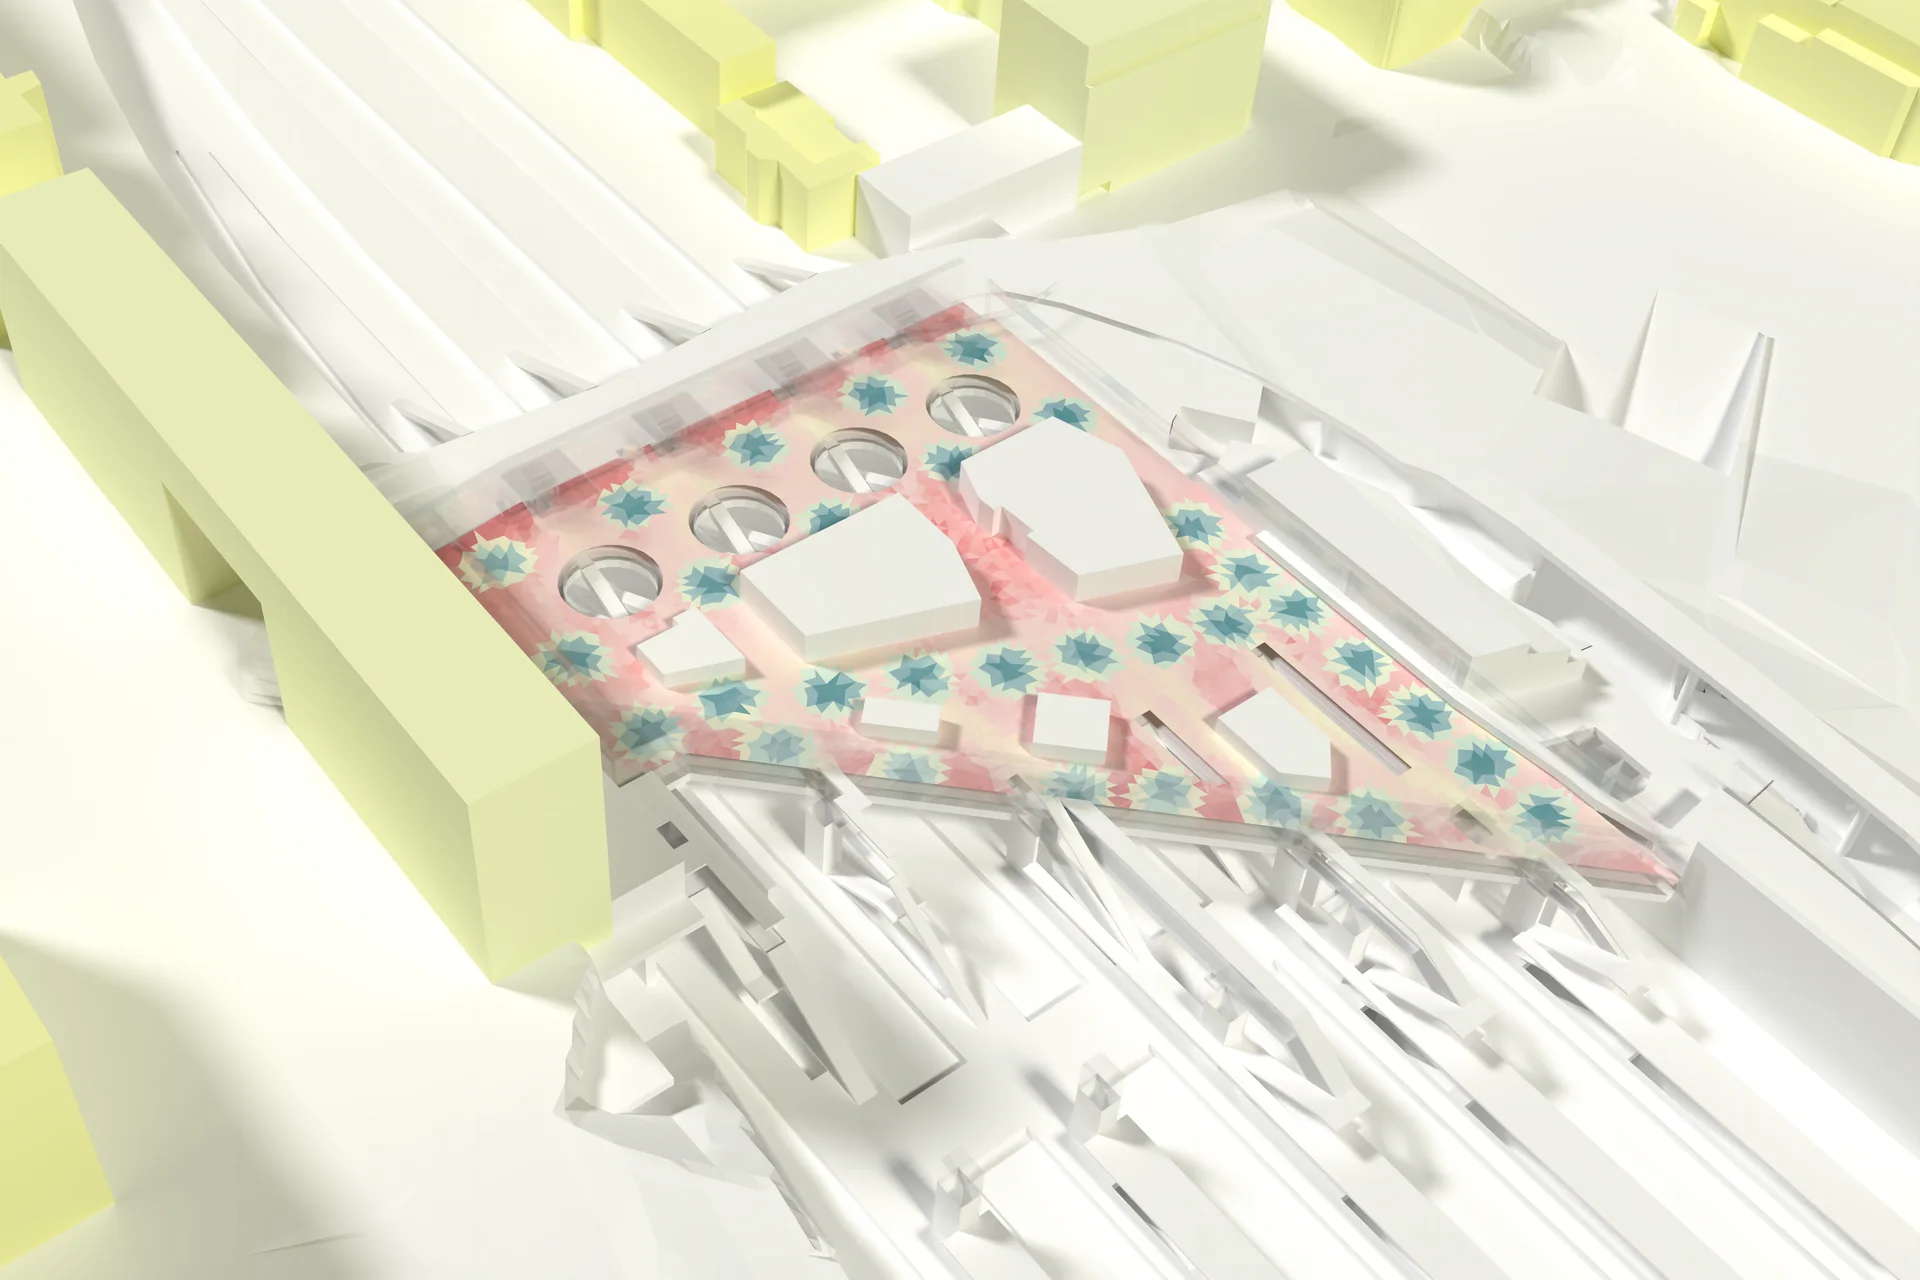
- Indoor comfort map (PET) inside a train station.
- I made this simulation at AREP L’hypercube, to study the installation of ceiling fans, (more information)
- Rendering done with Paraview 5.9.0, using OSPRay pathtracer
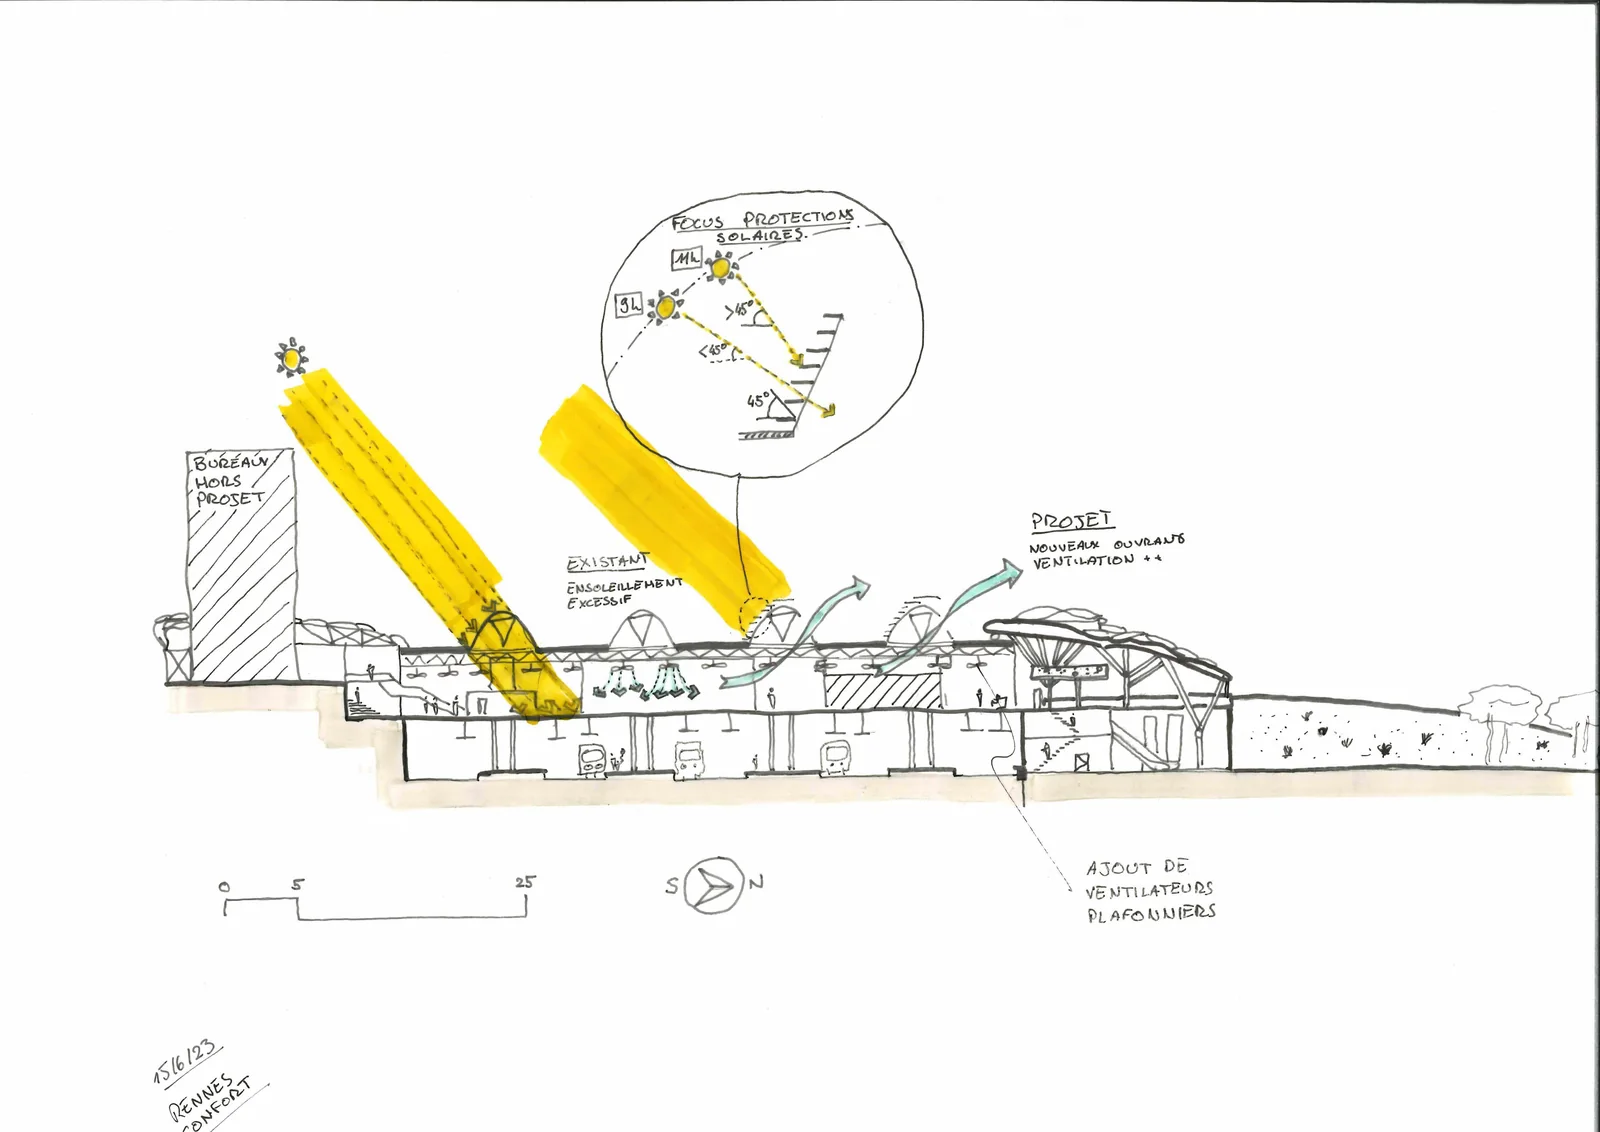
Bioclimatic principles // Rennes station
[06.2023]
A project sketch for Rennes station, illustrating key bioclimatic principles such as solar protection and natural ventilation.
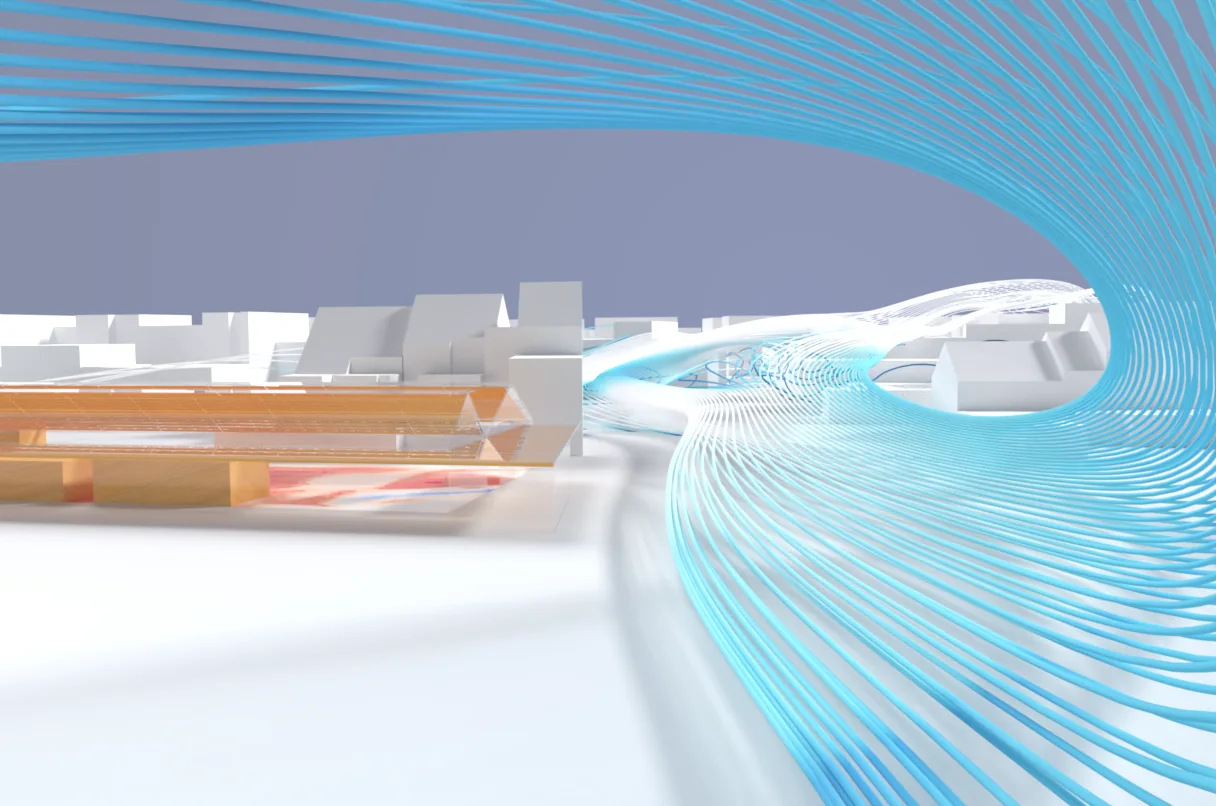
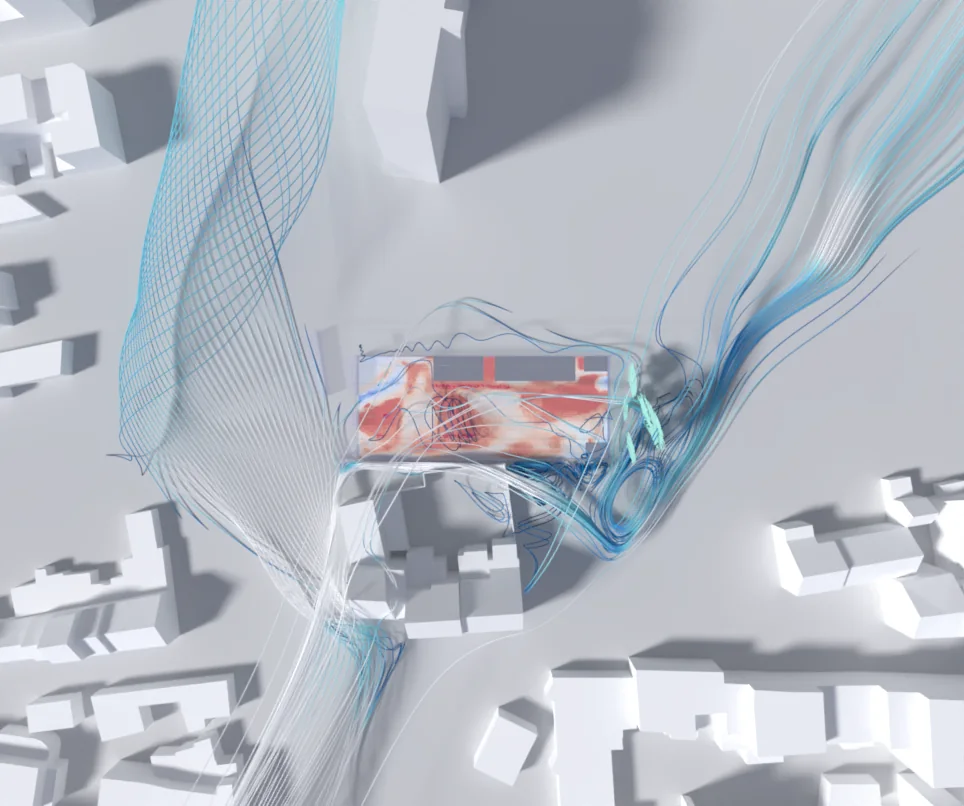
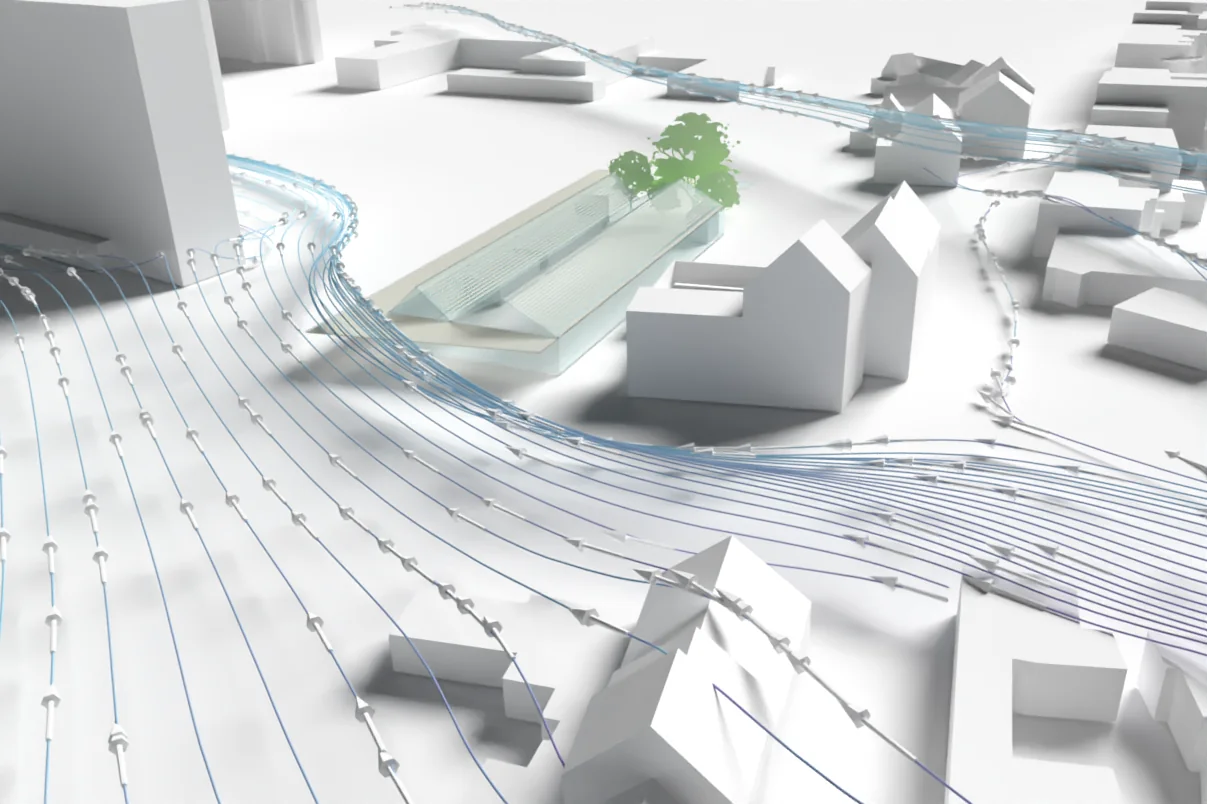
Climatic Comfort // The Wave
[09.2021]
- Indoor comfort map (PET) and urban wind around a project, carried out by AREP, in Belgium
- Simulation by AREP L’hypercube
- Rendering done with Paraview 5.9.0, using OSPRay pathtracer (ray-tracing engine)
Urban Heat Island // Paraview Ray Tracing and Animation Capabilities
[06.2020]
- Outdoor comfort levels (PET Index), hourly, during the hottest week of a typical year, in Strasbourg, France
- Simulations and couplings by AREP L’hypercube (CFD, Thermal, Solar, Comfort)
- Outdoor comfort and Urban Heat Island effects (more informations)
- Rendering done with Paraview 5.9.0, using OSPRay pathtracer (ray-tracing engine)

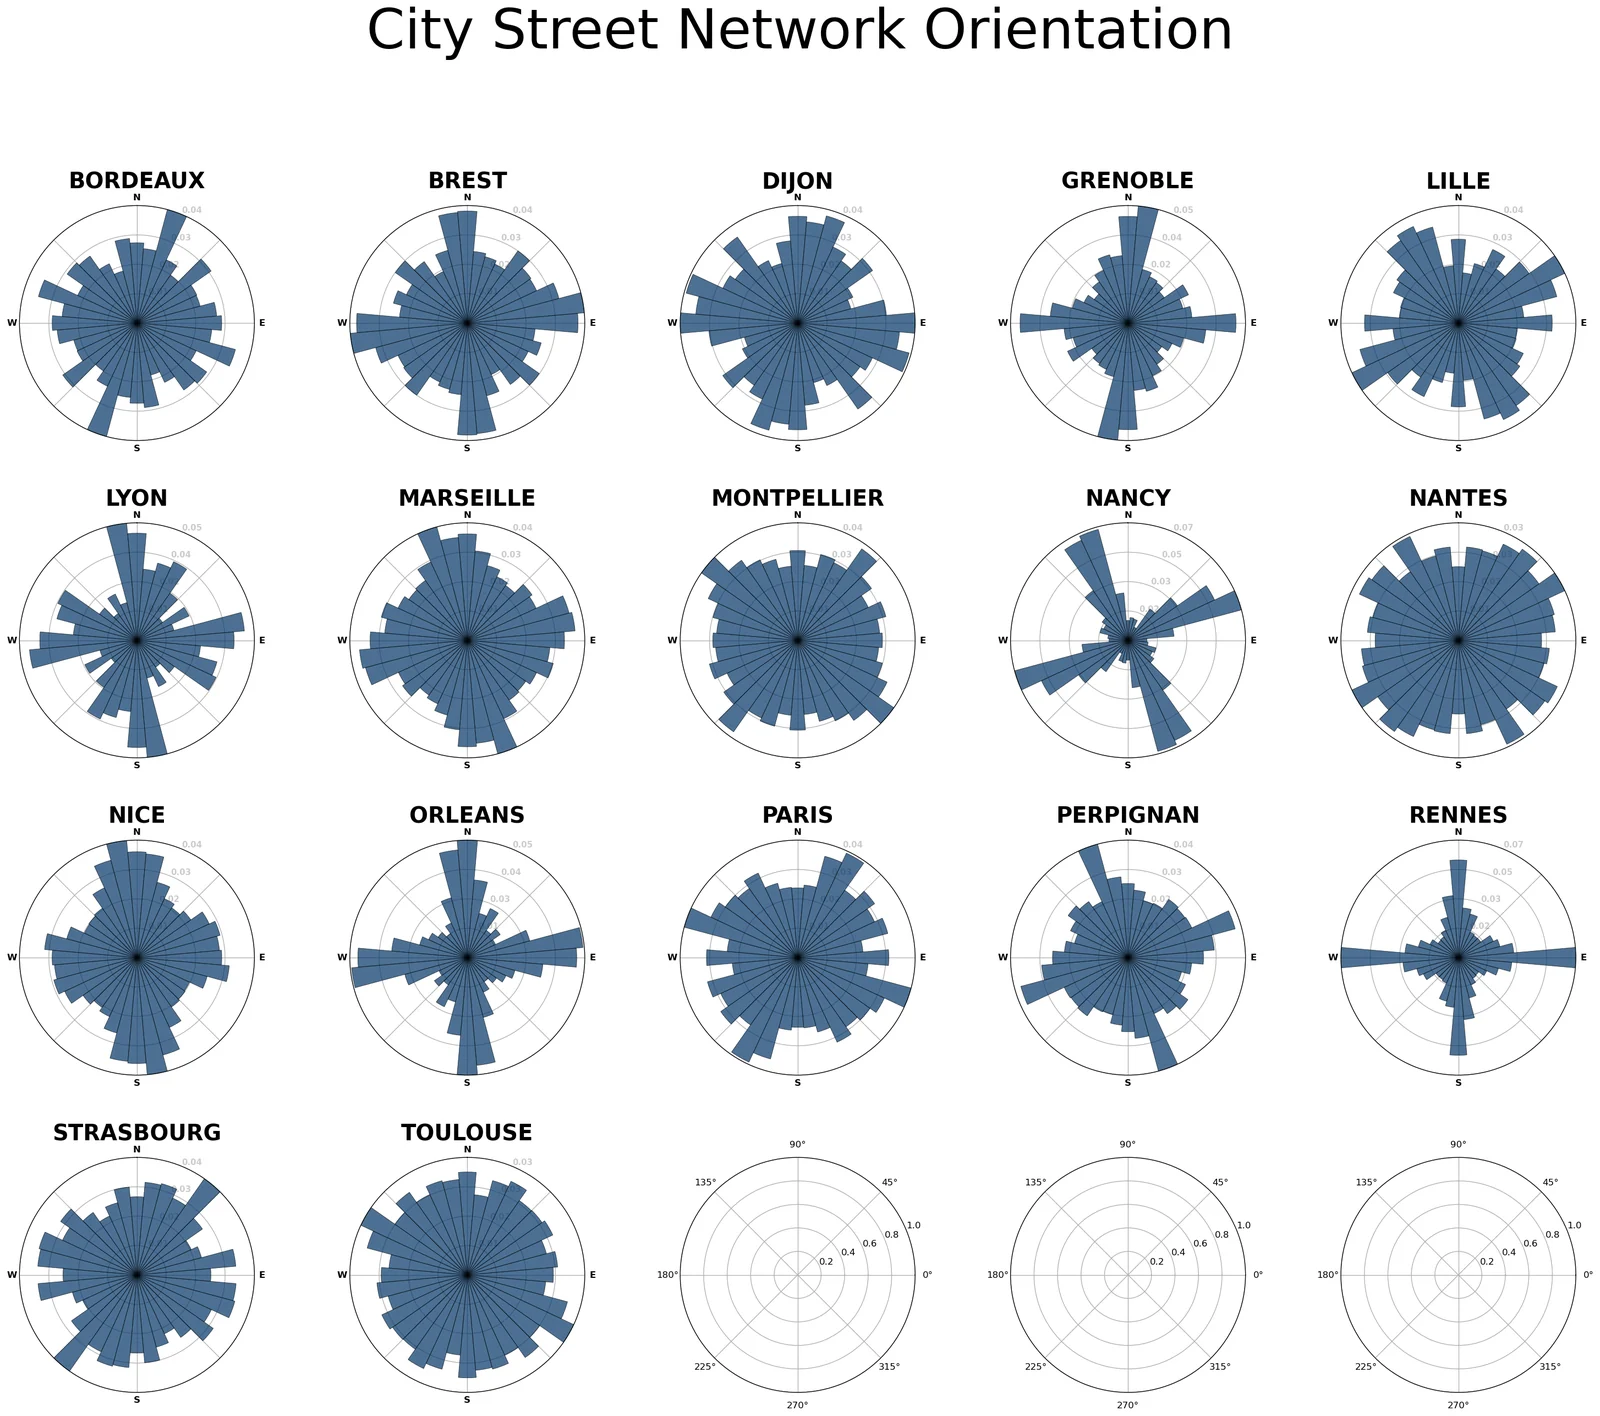
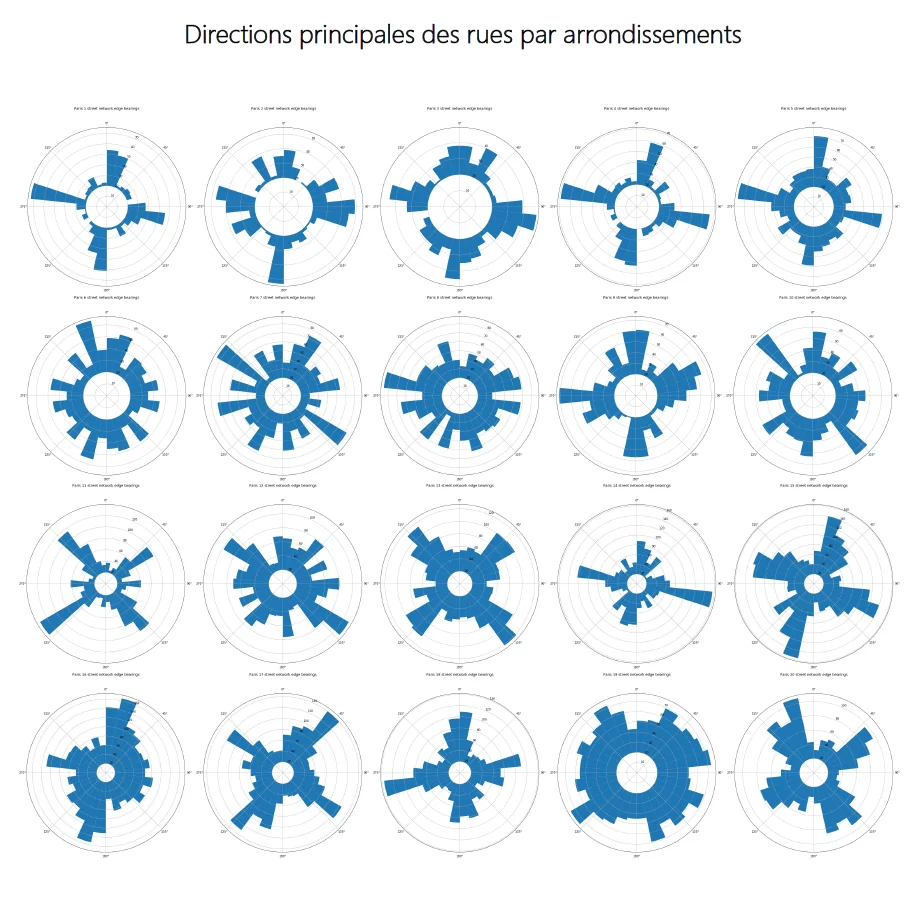
Street bearings // OSMnx
[2019]
Like wind roses for street networks, these polar histograms show how street orientations are distributed. Made in Python with OSMnx, developed by Geoff Boeing: the first compares several French cities, while the second compares the 20 arrondissements of Paris.
Le Havre architectural competition // Paraview Ray Tracing
[09.2019]
- Outdoor surface temperatures, including vegetation, during the hottest week of a typical year, in Le Havre, FRANCE.
- Simulations and couplings by AREP L’hypercube (CFD, Thermal, Solar), for an AREP response to an architectural competition (more information).
- Rendering done with Paraview 5.9.0, using OSPRay pathtracer (ray-tracing engine).
- First testing of the depth of field effects.
- First testing of the builtin material library (with PBR Lightning Physical Based Rendering).
Miscellanous // Paraview Ray Tracing
[2020-2021 updated 2025]
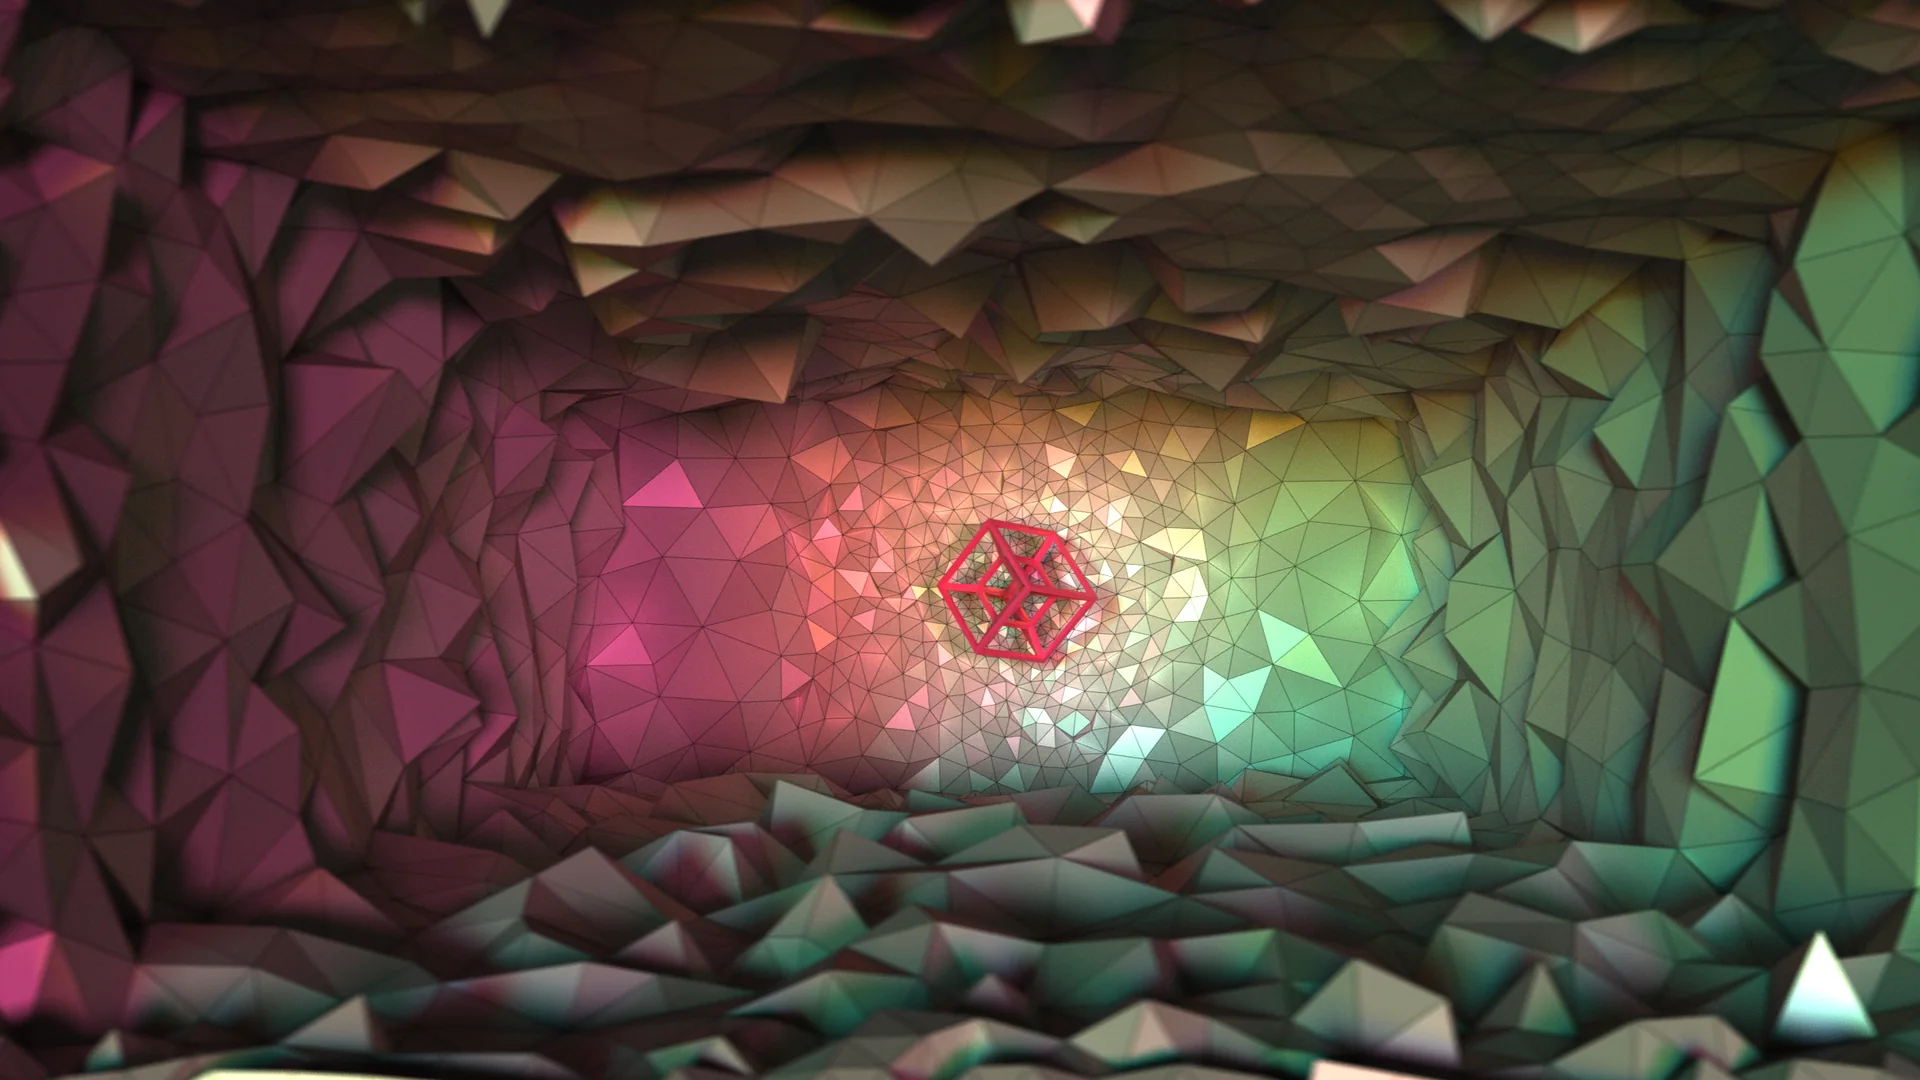
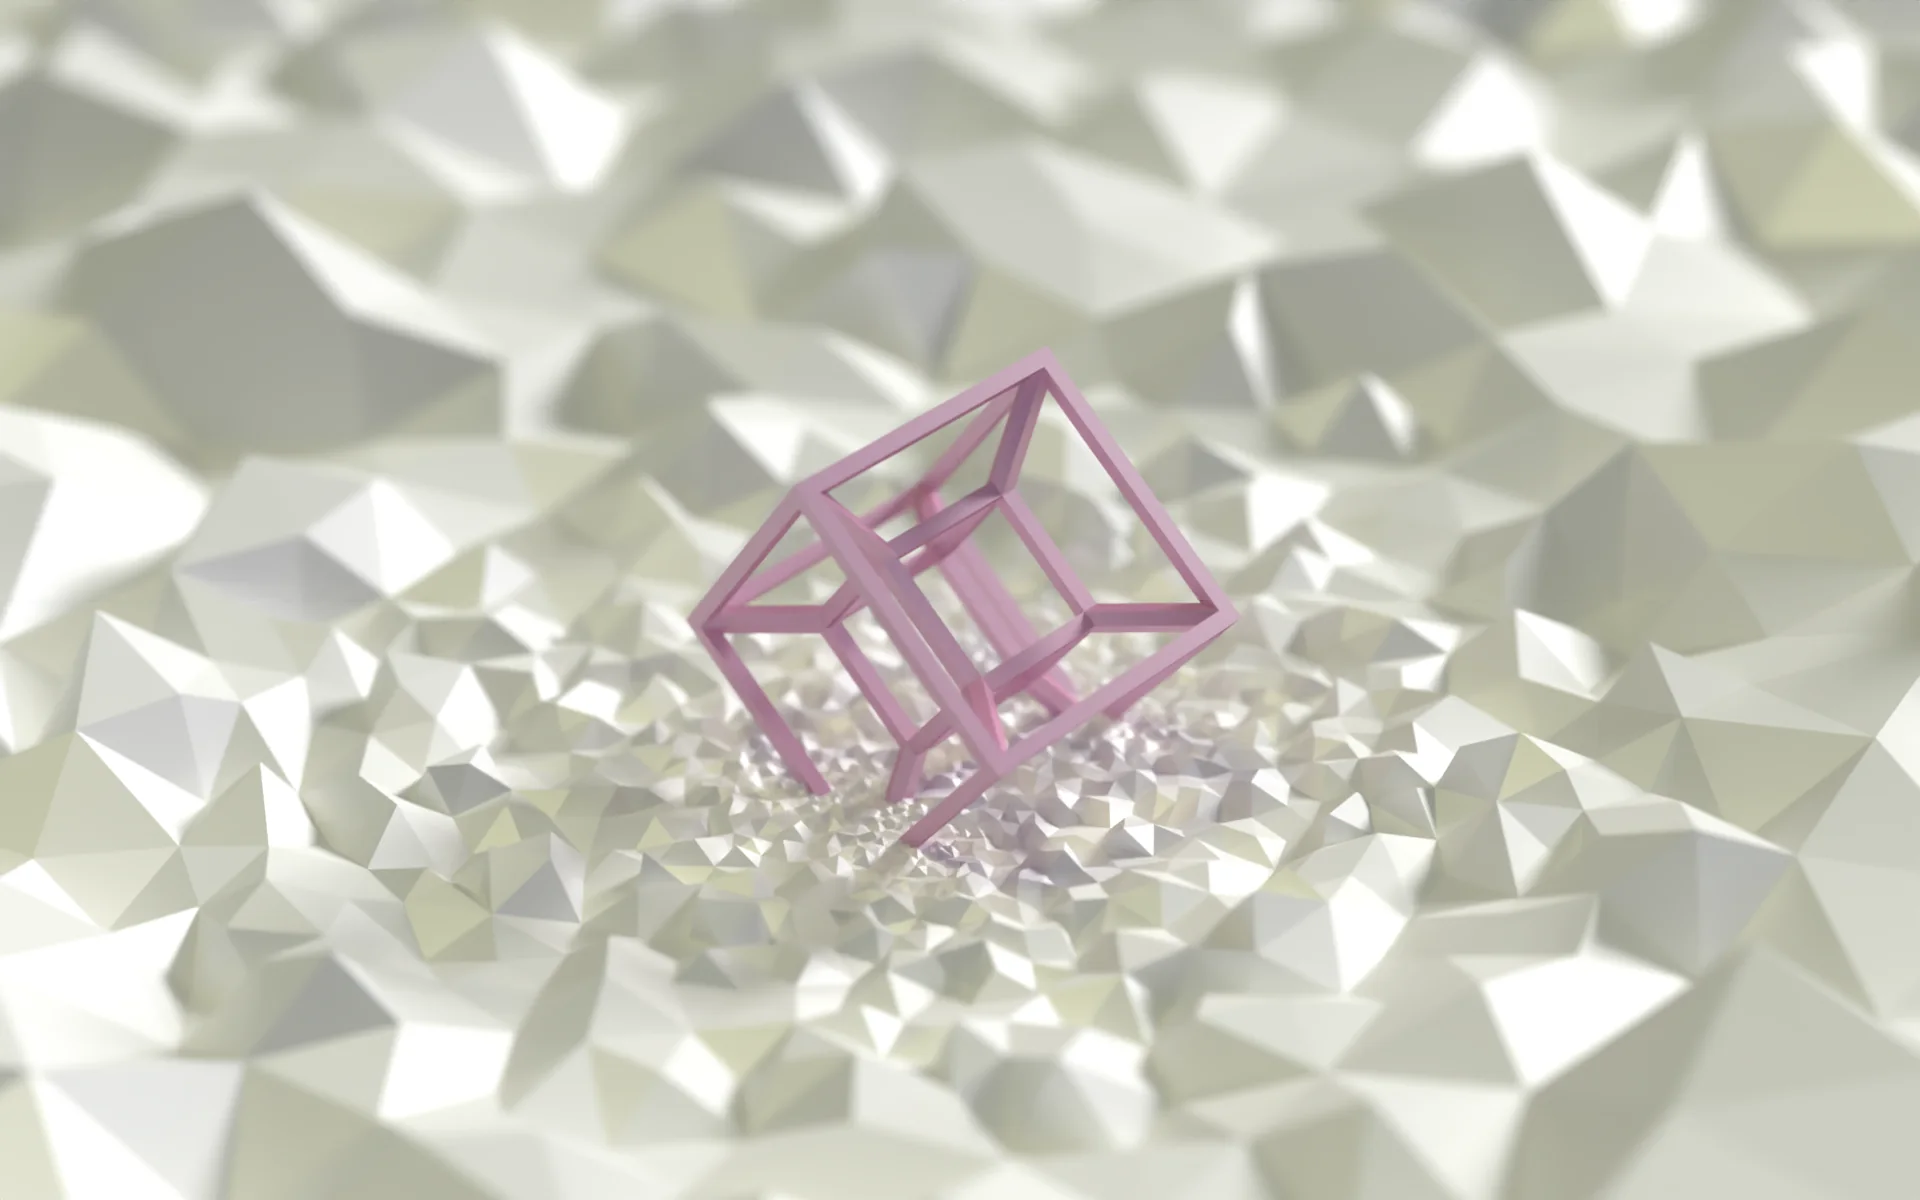
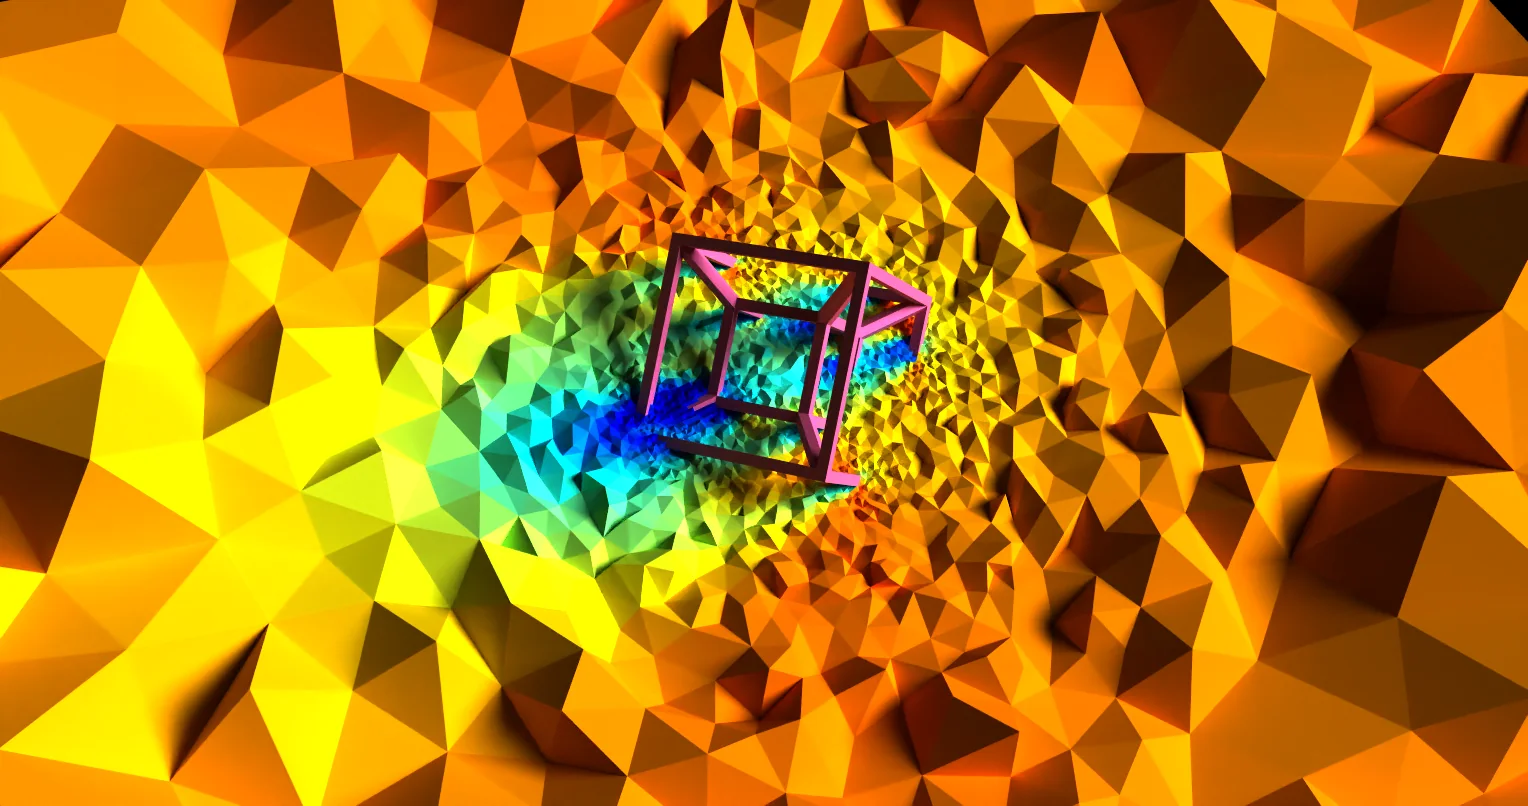
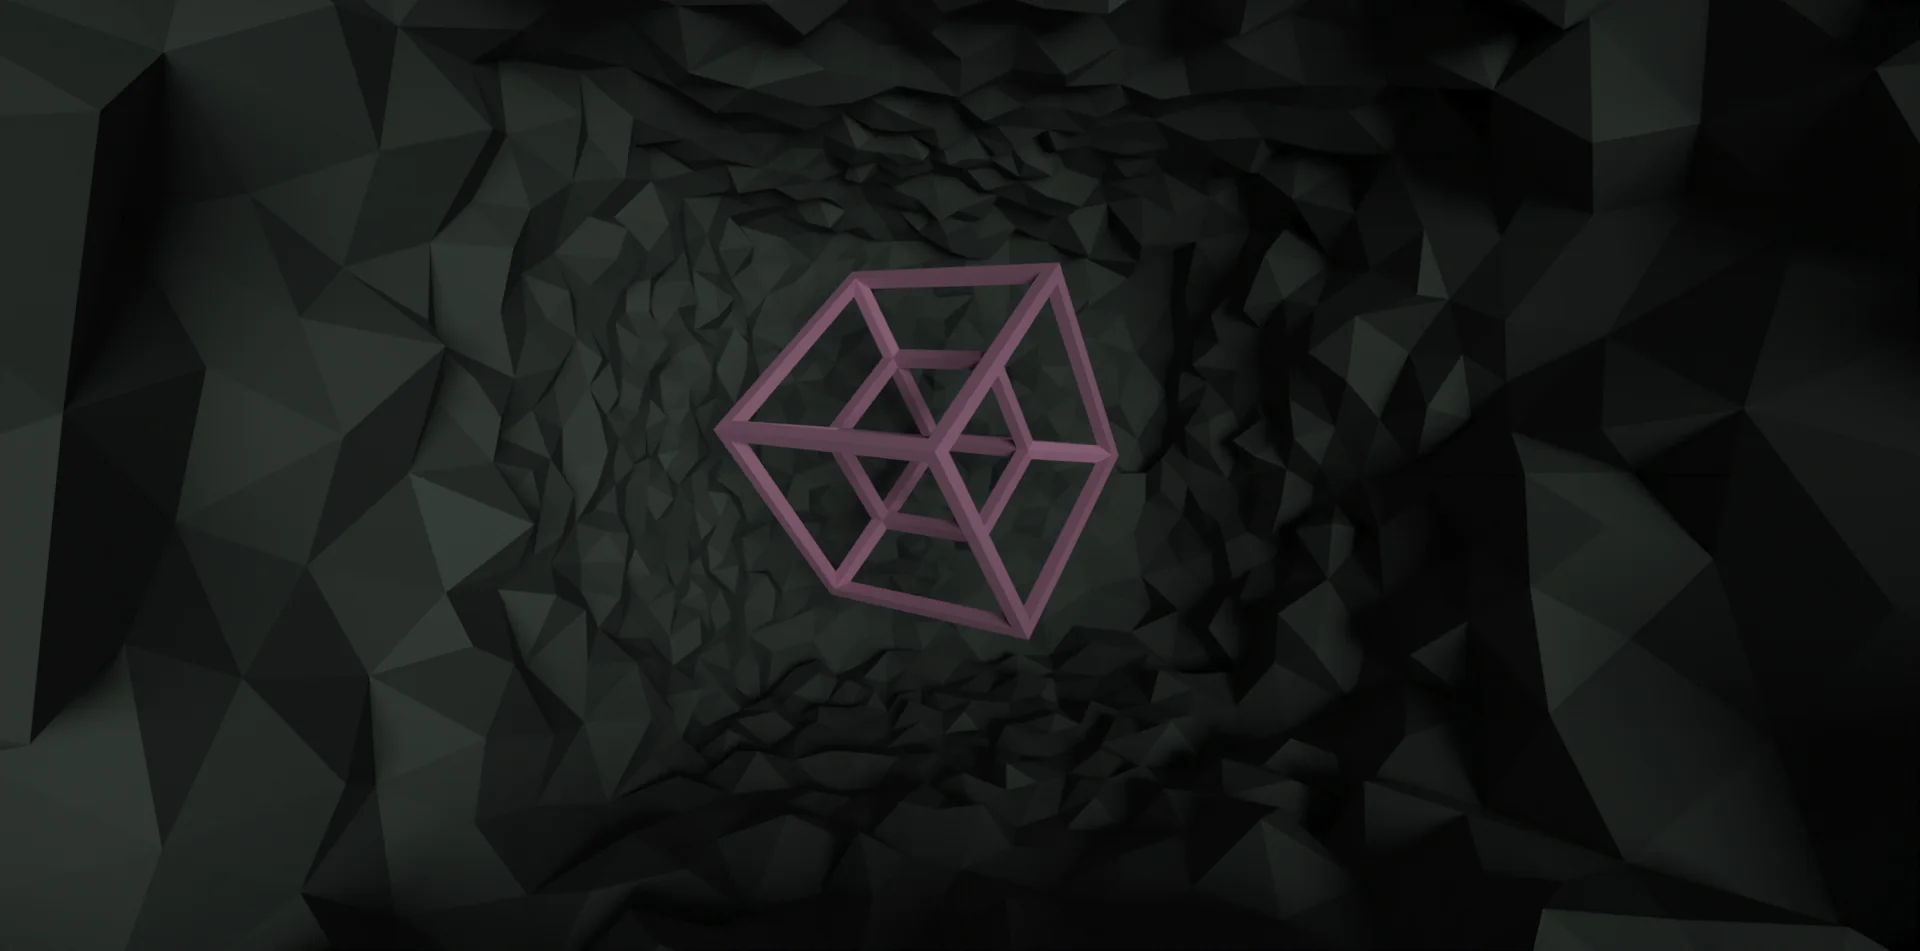
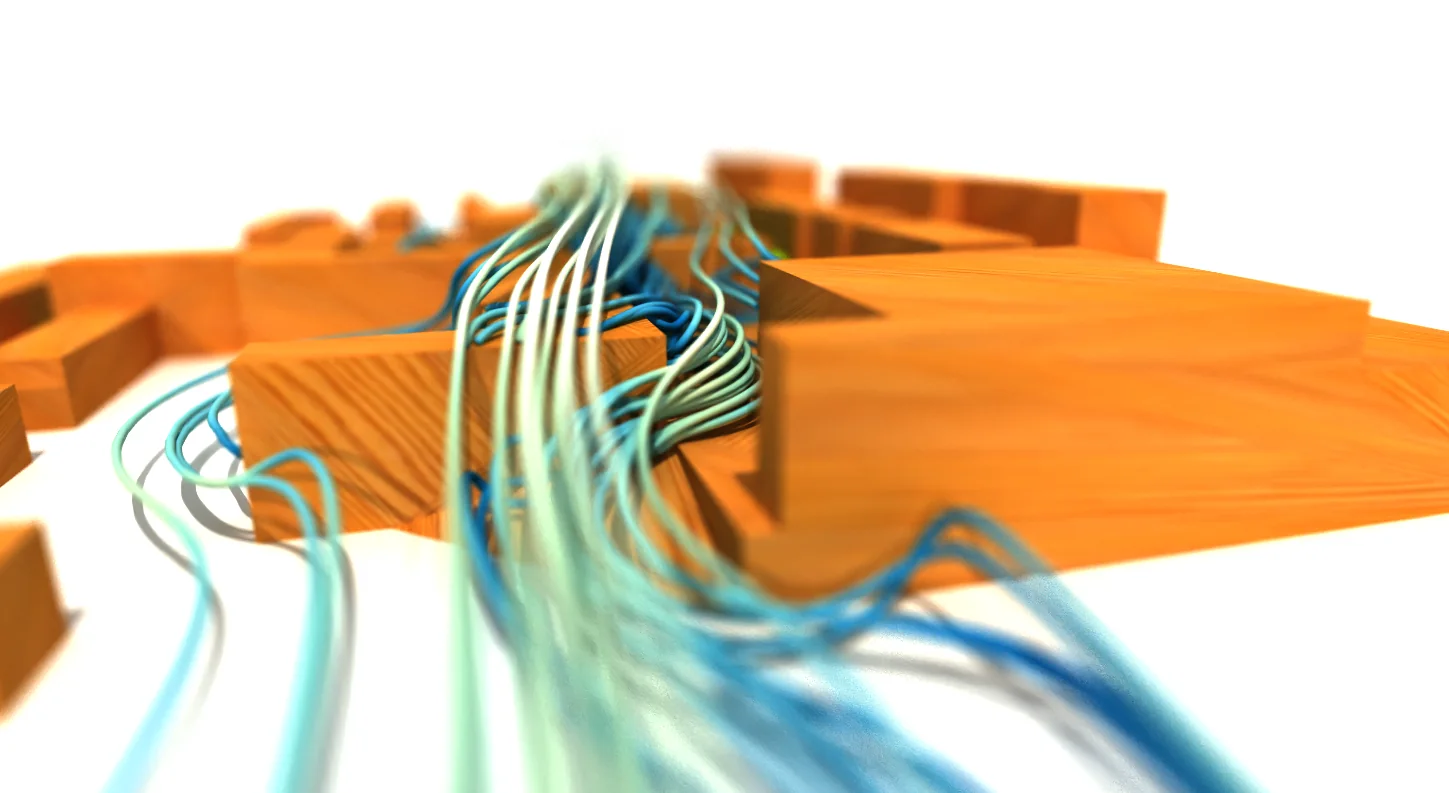
- Some visualization experiments on a CFD Hypercube mesh
- Rendering done with Paraview 5.9.1 / 5.13, using OSPRay pathtracer (ray-tracing engine).