Mateusz BOGDAN

My personal site, with a short presentation of who I am, my academic and professional activities and research interests !
| Home |
|---|
| About Me |
| Research |
| Publications |
| Teachings |
| Datavisualisation |
| Code |
| Inspirations - Links |
Code snippets
![]() -
- ![]()
Some useful tricks and hacks I use frequently, mostly in Python.
Python Basics
All my code snippets, my sort of personal cheet sheat, has been moved to this web site (in French), which I am developing as part of my teaching activities (work in progress). It is intended for students and covers Python fundamentals as well as practical dataframe tips.
Learn Python
[In French] Python fundamentals, for Basics, NumPy, Pandas and Visualization
Python-Lab
[In French] Interactive notebooks that cover all sections of Learn Python !
Maps and GIS related questions
Recently I’ve ben working with maps in python applications. I mostly use geopandas, dash-leaflet, plotly.scattermapbox, etc.
Distance between two points on a sphere
Compute the distance in km (or meters) between 2 points of the globe defined by their respective lat / lon.
- It’s called a Haversine function.
- Basically, it’s trigonometry on a sphere !
- In the code snippet below
- If needed, you can adjust for the radius, with the last constant, which is
2*earth radius, in km, - To make thiong easy and work with degrees, everything is converted, hence the
p=0.017453292519943295value, which is actually a simplification, it should bep=Pi/180!def distance(lat1, lon1, lat2, lon2): # Haversine function to get distance in km from lat/lon points p = 0.017453292519943295 hav = 0.5 - cos((lat2-lat1)*p)/2 + cos(lat1*p) * \ cos(lat2*p) * (1-cos((lon2-lon1)*p)) / 2 # 2*6371.04 ~ 12742 (2*earth radius, in km) return 12742 * asin(sqrt(hav))
- If needed, you can adjust for the radius, with the last constant, which is
Moving on a sphere
- Starting from a point on an map defined by its latitude and longitude, what are the new cordinates if one moves, say 50m “to the right” (e.g. East), and 10m up (North) ? I’ve been strugling with that in pure python (some libraries probably do this type of calculation, but I wanted no dependancy). The solution I found comes from here.
It’s a function that allows you to compute exactly that: start from a point, move
xmeters in the “latitude” direction andymeters in the “longitude” direction, and compute the new coordinates:def translate_latlong(lat,long,lat_translation_meters,long_translation_meters): ''' method to move any lat,long point by provided meters in lat and long direction. params : lat,long: lattitude and longitude in degrees as decimal values, e.g. 37.43609517497065, -122.17226450150885 lat_translation_meters: movement of point in meters in lattitude direction. positive value: up move, negative value: down move long_translation_meters: movement of point in meters in longitude direction. positive value: left move, negative value: right move ''' earth_radius = 6378.137 #Calculate top, which is lat_translation_meters above m_lat = (1 / ((2 * np.pi / 360) * earth_radius)) / 1000; lat_new = lat + (lat_translation_meters * m_lat) #Calculate right, which is long_translation_meters right m_long = (1 / ((2 * np.pi / 360) * earth_radius)) / 1000; # 1 meter in degree long_new = long + (long_translation_meters * m_long) / np.cos(lat * (np.pi / 180)); return lat_new,long_new
Miscellaneous Functions
Daylength computation
What is the length of the day in hours ?
I needed to compute the length of days for a complete year, and I started using python libraries like pvlib with its module solarposition() or suntime to get the hours of sunset and sunrise. I kept looking for other solutions as I wanted to avoid dependancies, and i found a post on stackoverflow which gives you exactly that.
It is based on a paper by [Forsytthe et al., 1995], named A Model Comparison for Daylength as a Function of Latitude and Day of Year. It uses only the day_of_year and latitude and returns the length of the day in hours (and even have different definitions for the length of a day).
Usefully, one can provide a list of days of the year (or rather an np.array), and the function will return an array of the same length with daylengths :
- For a complete year calculation, I used
J = np.array([i for i in range(1,366)]).
def day_length(J, L):
    """
    -----------------------------------------------------------------------------------------
    Based upon : "A model comparison for daylength as a function of latitude and day of year"
    Forsythe et al., 1995, Ecological Modelling 80 (1995) 87-95
    -----------------------------------------------------------------------------------------
    Parameters
    ----------
    J: int / list of int / array
        day of the year.
    L: float
        latitude (in °)

    Returns
    -------
    Lenght of the day(s) in hours

    To account for various definitions of daylength, modify the "p" value accordingly.
    * Sunrise/Sunset is when the center of the sun is even with the horizon
    p = 0
    * Sunrise/Sunset is when the top of the sun is even with horizon
    p = 0.26667
    * Sunrise/Sunset is when the top of the sun is apparently even with horizon
    p = 0.8333

    """
    p = 0.8333
    phi = np.arcsin(
            0.39795 * ( np.cos( 0.2163108 + 2 * np.arctan( 0.9671396 * np.tan( 0.00860 * (J-186) ) ) ) )
        )
    D = 24 - (24/np.pi)*np.arccos(
              ( np.sin( p*np.pi/180 ) + np.sin( L*np.pi/180 ) * np.sin( phi ) ) / (np.cos(L*np.pi/180) * np.cos( phi ) )
        )

    return D
Solar declination from day of year
Solar declination is the tilt of the sun relative to Earth’s equator, varying from −23.44° to +23.44° through the year With a widely used approximation, the computation is pretty straight forward !
- Very compact,
- captures seasonal cycle
- good enough for many building / climate applications
import numpy as np

def solar_declination(day_of_year):
    """
    Approximate solar declination angle (degrees).

    Parameters
    ----------
    day_of_year : int or array-like
        Day of year (1–365)

    Returns
    -------
    float or ndarray
        Solar declination angle in degrees
    """
    return 23.44 * np.sin(2 * np.pi * (day_of_year - 81) / 365)
Shoelace formula : polygon area
import numpy as np

def polygon_area(vertices: np.ndarray, signed: bool = False) -> float:
    """
    Compute the area of a 2D polygon using the shoelace formula.

    Parameters
    ----------
    vertices : (n, 2) ndarray
        Polygon vertices in order (clockwise or counterclockwise).
        The polygon is assumed closed implicitly.
    signed : bool, default=False
        If True, return the signed area.
        If False, return the absolute area.

    Returns
    -------
    float
        Polygon area.
    """
    vertices = np.asarray(vertices, dtype=float)

    if vertices.ndim != 2 or vertices.shape[1] != 2:
        raise ValueError("vertices must have shape (n, 2)")
    if len(vertices) < 3:
        raise ValueError("a polygon needs at least 3 vertices")

    x = vertices[:, 0]
    y = vertices[:, 1]

    area = 0.5 * np.sum(x * np.roll(y, -1) - y * np.roll(x, -1))
    return area if signed else abs(area)
Basic example:
square = np.array([
    [0.0, 0.0],
    [1.0, 0.0],
    [1.0, 1.0],
    [0.0, 1.0],
])

print(polygon_area(square))          # 1.0
print(polygon_area(square, signed=True))
Why it is elegant ? It is:
- short
- vectorized
- exact for planar polygons in Cartesian coordinates
- easy to read once you know the formula
Signed area If the vertices are:
- counterclockwise → signed area is positive
- clockwise → signed area is negative
That can be useful for checking orientation.
Performance
Pairwise distance matrix
Useful for geometry but also clustering, nearest-neighbor precomputation, and many numerical workflows.
import numpy as np
def pairwise_distance_matrix(X: np.ndarray) -> np.ndarray:
    """
    Compute the full pairwise Euclidean distance matrix.

    Parameters
    ----------
    X : (n, d) ndarray
        Array of n points in d dimensions.

    Returns
    -------
    D : (n, n) ndarray
        Pairwise Euclidean distance matrix.
    """
    X = np.asarray(X, dtype=float)
    diff = X[:, None, :] - X[None, :, :]
    return np.sqrt(np.sum(diff**2, axis=-1))
Basic example:
pts = np.array([
    [0.0, 0.0],
    [1.0, 0.0],
    [1.0, 1.0],
])

D = pairwise_distance_matrix(pts)
print(D)
Why it is elegant ? It uses NumPy broadcasting instead of explicit Python loops:
X[:, None, :]has shape(n, 1, d)X[None, :, :]has shape(1, n, d)- subtraction produces all pairwise differences with shape
(n, n, d)
This is compact and usually much faster than nested Python loops for moderate sizes.
Note:
For very large n, this allocates an (n, n, d) array, which can be expensive in memory.
Cache expensive computations
Very useful when the same deterministic function is called repeatedly with identical arguments.
from functools import lru_cache

@lru_cache(maxsize=None)
def expensive_function(n: int) -> int:
    """
    Example of a cached pure function.

    Parameters
    ----------
    n : int
        Input integer.

    Returns
    -------
    int
        Sum of squares from 0 to n-1.
    """
    print(f"Computing for n={n}...")
    return sum(i * i for i in range(n))
Basic example:
print(expensive_function(10_000))
print(expensive_function(10_000))  # returned instantly from cache
Why it is elegant ? @lru_cache gives you memoization in one line.
It works best when:
- the function is pure
- the inputs are hashable
- the same calls happen repeatedly
Typical uses:
- recursive functions
- geometric kernels
- repeated configuration-dependent computations
- parsing and lookup helpers
Important limitation: arguments must be hashable. So plain lists or NumPy arrays cannot be used directly as cache keys unless converted.
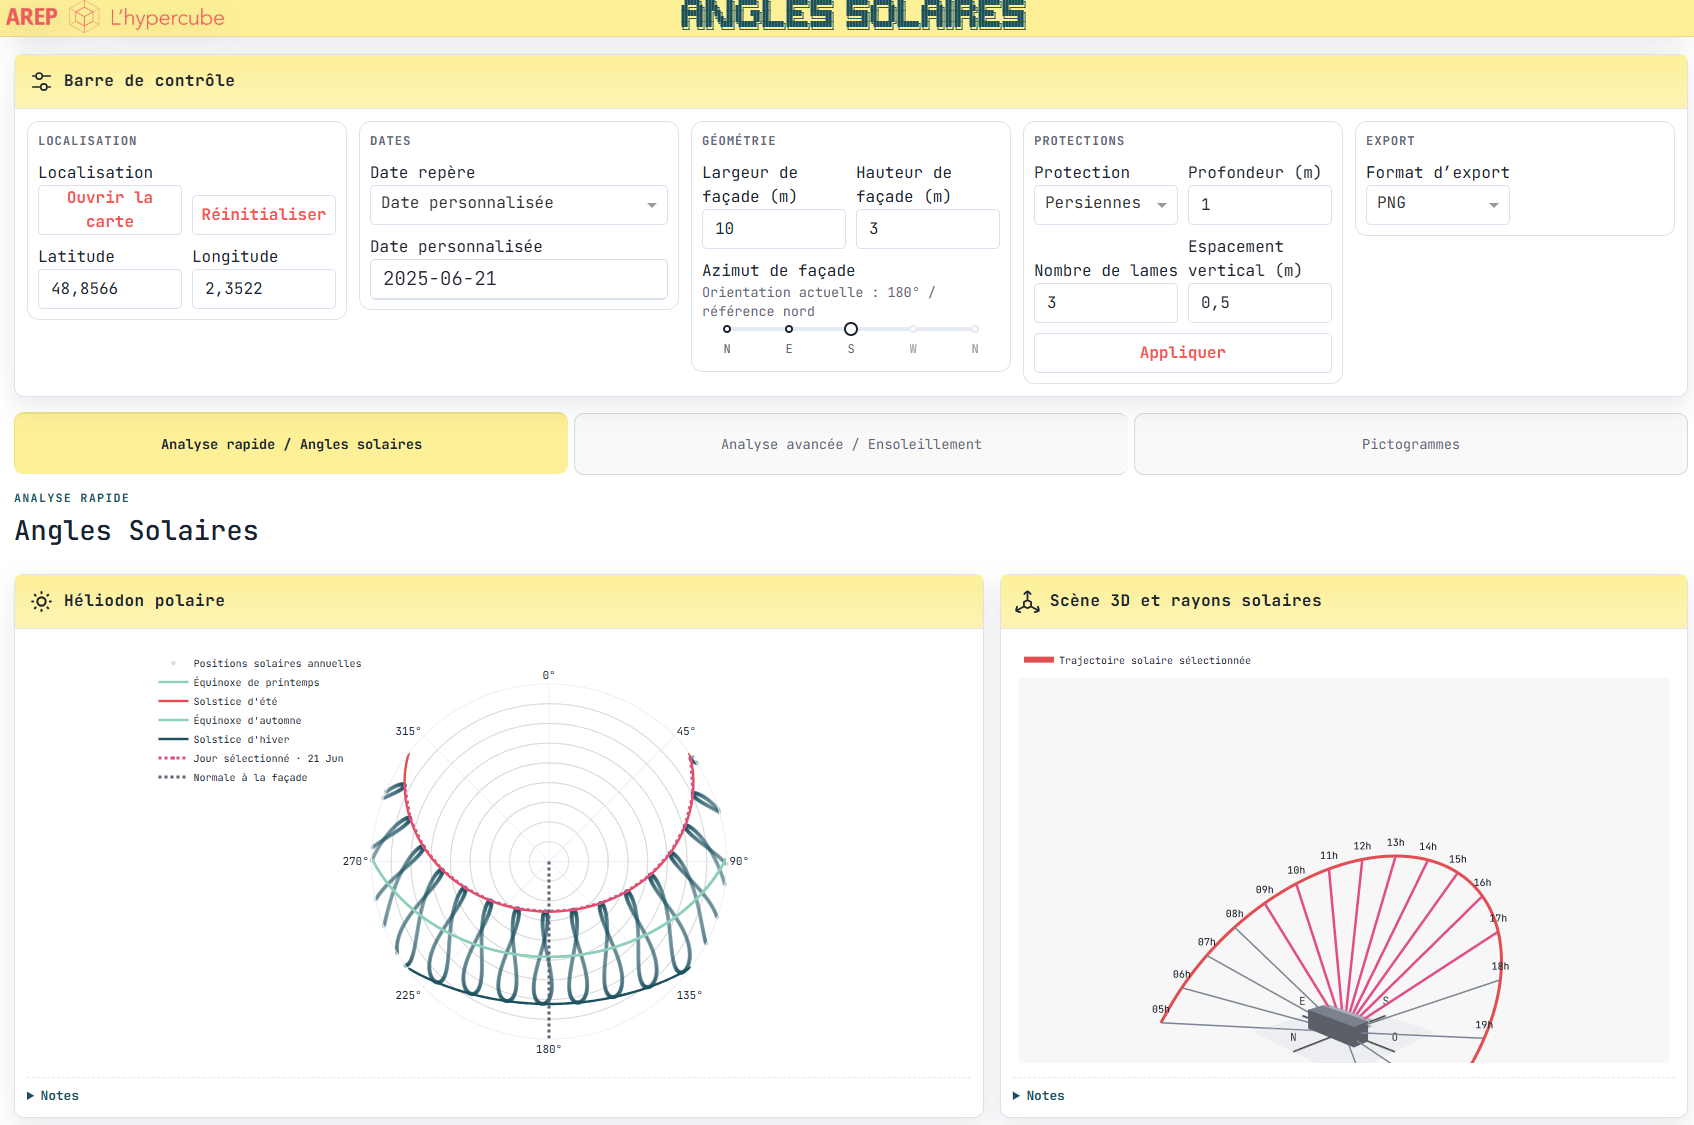
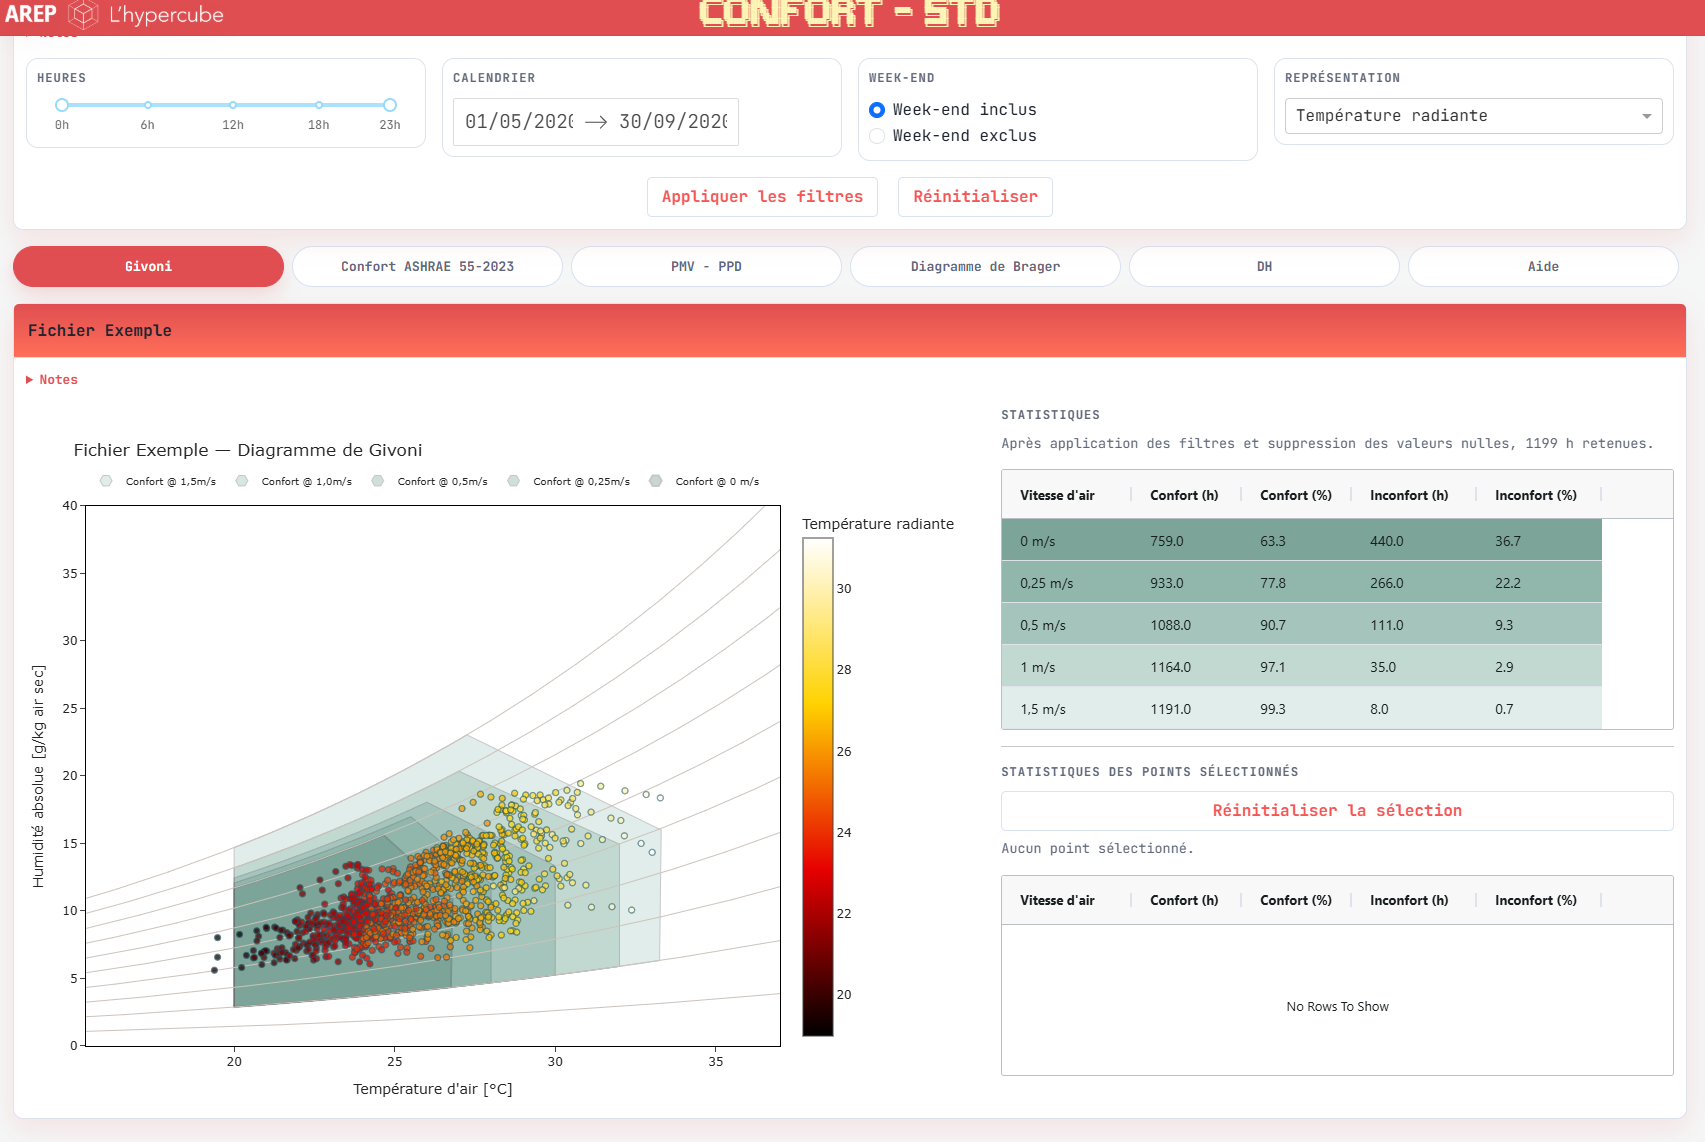
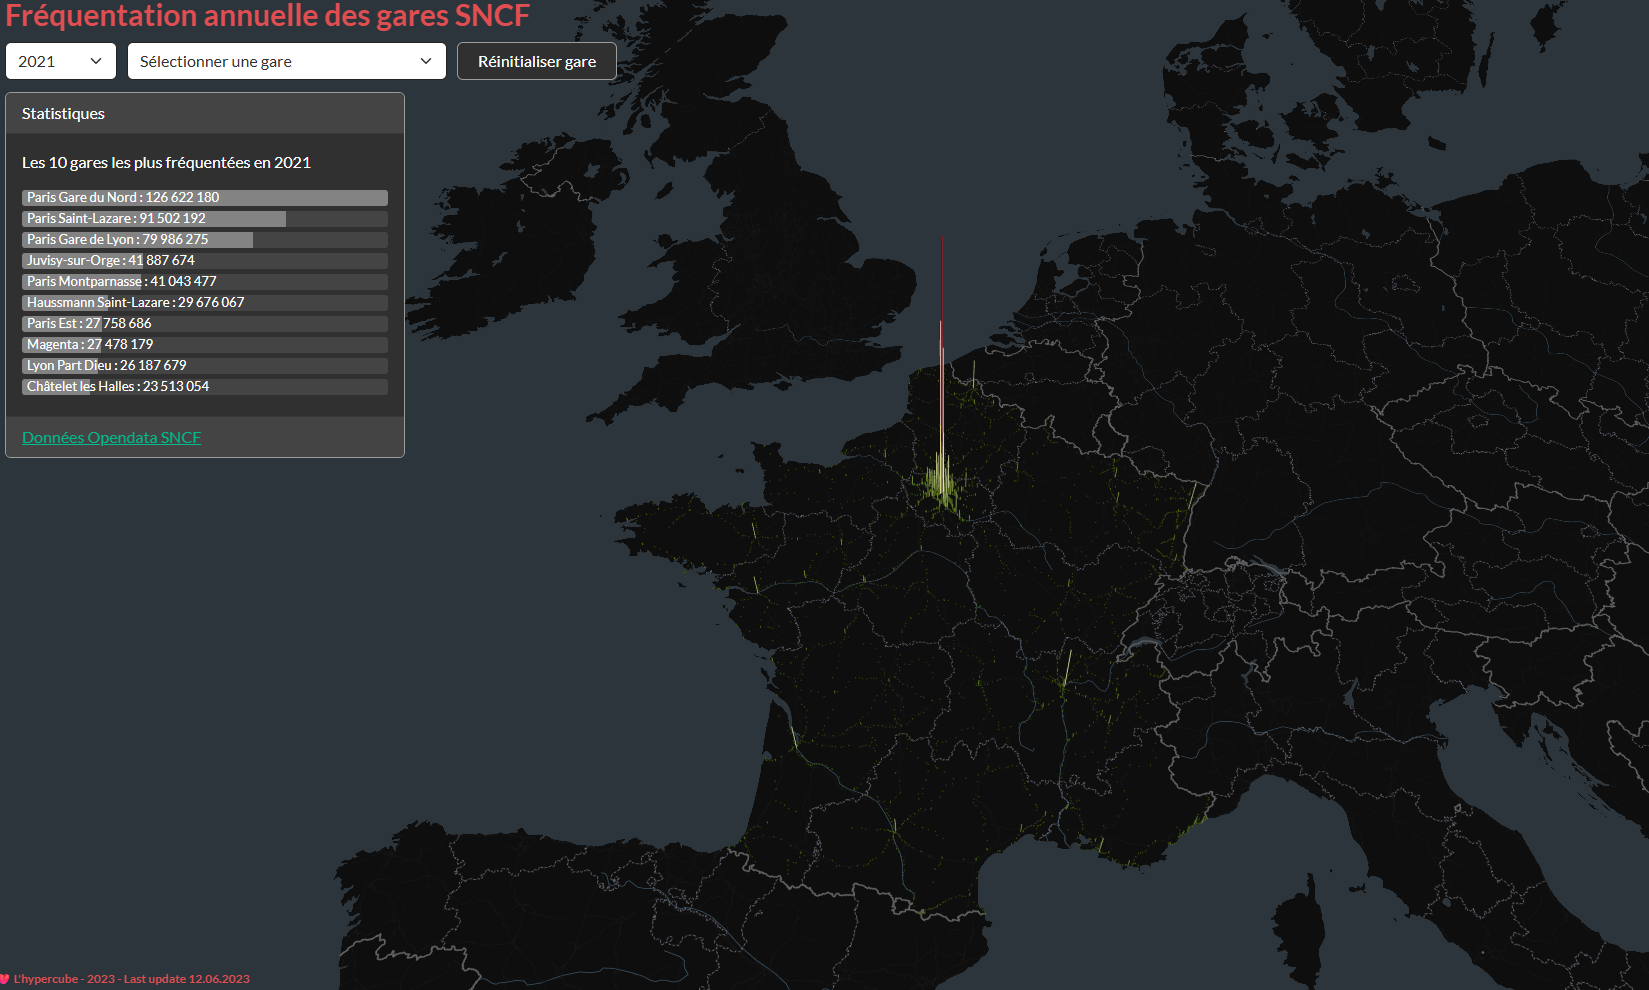
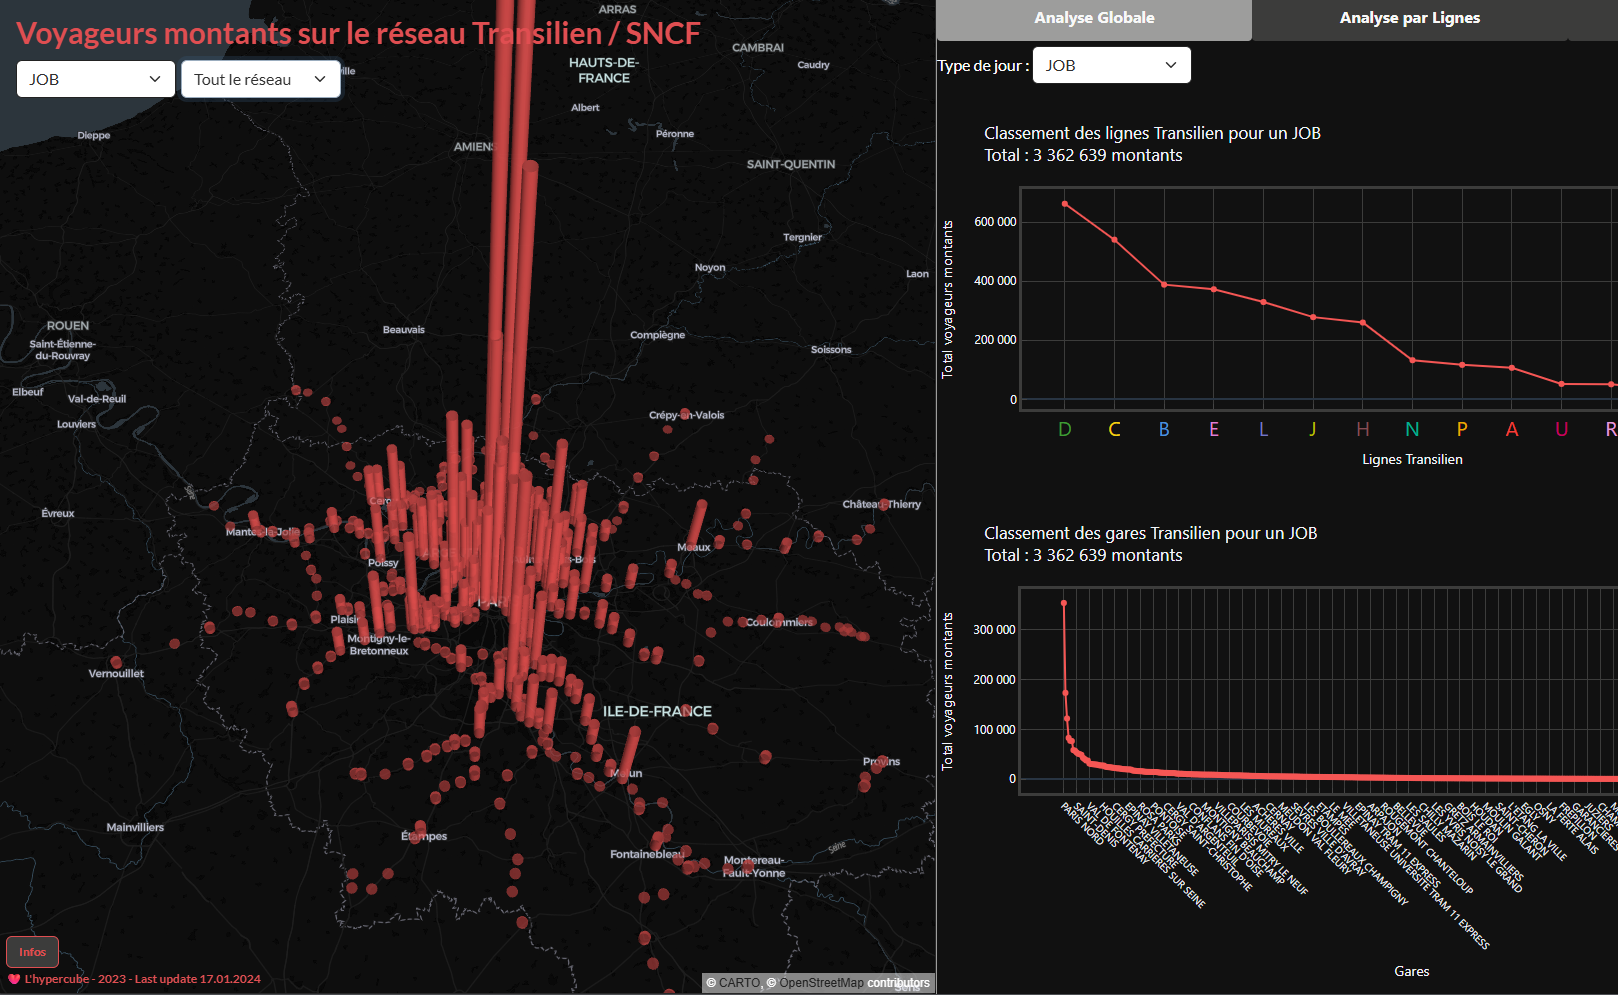
Web developments
I also contribute to bridging research and practice through web applications and digital tools.
- Development and maintenance of my team’s blog L’Hypercube, covering both front-end and back-end (Hugo, deployed on a cloud Ubuntu VM).
- Development of several dashboards with Dash, mainly internal to AREP, with some made publicly available on our website (see below).